The SPX started the day to the downside, continuing
the pullback from yesterday’s 1711.03 high.
After dropping to 1701.03, the index started to move higher, and made
the high of the day at 1711.57. This was slightly above yesterday’s high, and
right at the 1711-1713 level I pointed to in yesterday’s post as a possible
high. This did not happen exactly as I thought, but the level turned out to be
correct none the less. From there the SPX started to sell off, dropping back below
1700 to 1695.93 an hour before the close. The last hour saw the SPX rise to
1704.46 before settling back to 1698.06.
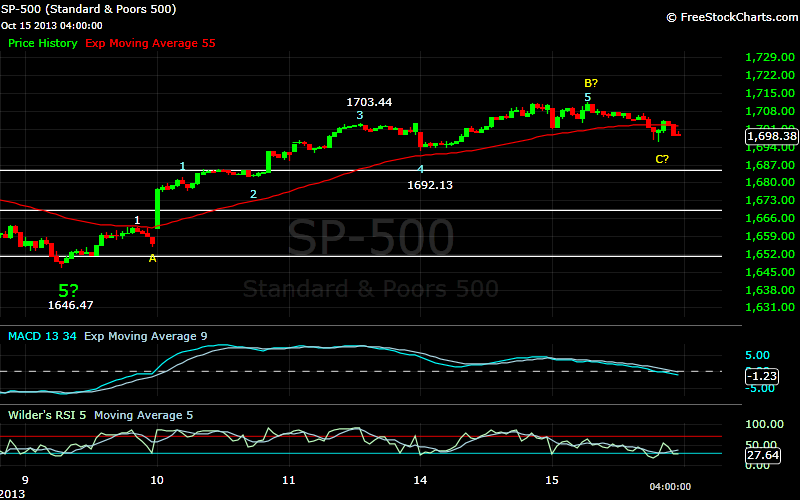
Continuing the count from last Wednesday’s low of 1646.47,
today’s high would appear to be wave B of an inverted corrective wave, followed
by wave C at 1695.93. If the move to 1704.46 was wave D, wave E would project
to 1690. If D has not ended, the market should be higher from here before
starting wave E down.
Considering today’s nearly 16 point drop from
1711.57 to 1695.93, another count has presented itself. The three largest
pullbacks since 1646.47 have been 1662.47-1654.81, or slightly less than 8
points, 1703.44-1692.13, or 11 points, and 1711.57-1695.93, or 16 points. This
may have completed an inverted corrective wave, and would point to a target of
1745.
I continue to see this market moving higher, with
a target for this wave of 1745. Considering everything that is going on in
Washington at the moment it is difficult to have absolute conviction on
anything, but my wave count points to higher prices. There may be a
continuation of the pullback before the index moves higher, but I would expect
this to remain above 1685. A move below this level would mean my current
assumptions are wrong.
Resistance is at 1703, and then 1723, with support
at 1685, and then 1669.
No comments:
Post a Comment