Tuesday, September 30, 2014

Tuesday's Market 09/30/2014

It was another up and down for the SPX today. This choppy action has been the norm for the better part of four days, and has been difficult to follow on the short term. I thought it best to focus on the longer term today, and outline the possibilities as they stand at the moment.


Looking at the Weekly chart, I identified 4 waves that completed from 1074.77 to 1560.33, with the SPX needing only to complete the 5th wave to complete the sequence from 1074.77.


On the Daily chart I identified a complete 5 wave sequence from 1560.33 to the recent 2019.26 high. The completion of this wave at 2019.26 would complete the 5th wave from 1074.77, and therefore I have been looking at that point as the termination of a 5 wave sequence from 1074.77. Unless the SPX moves above 2019.26 it appears the index is in the beginning stages of a correction of that sequence.


On the 60 Minute chart, the initial decline to 1978.63 looks to be a first wave a sequence lower. From that point, the SPX moved higher to 1999.79, lower to 1965.99, back up to 1986.37, back down to 1964.04, and then made one more move higher to 1985.17. Looking at this sequence gives 1978.63-1999.79-1965.99-1986.37-1964.04-1985.17. The points (1978.63, 1999.79), (1965.99, 1986.37), (1964.04, 1985.17) gives an R^2 value of .99756, meeting the parameters for a 5 wave sequence, and possibly the completion of an inverted corrective wave from 1978.63, or the second wave from the 2019.26 high. If this count is correct, I would expect a resumption of the decline from this point.

My concern with this count is the shorter term counts, which makes it difficult to be certain of this count. After the initial decline from 2019.26, I had somewhat expected a slightly different correction to form, namely a semi-inverted corrective wave, which is still a possibility. If it does occur now, it would actually contain another semi-inverted corrective wave within it. This would look something like this:


If this scenario does play out, the SPX should move up to 1989, pullback with the index holding above 1978.48, and then move above 1999.79, but falling short of new highs. The next few days should give us a good idea of which path the SPX is taking.

Monday, September 29, 2014

Monday's Market 09/29/2014

It was another interesting day, where obviously Friday’s rally did not continue as I had anticipated. Instead the SPX fell sharply at the open, dropping to 1964.04. From there the index rallied in somewhat choppy trading, cutting the bulk of its losses.


Although this wave did not play out completely as anticipated, I am still inclined to believe that this is a convoluted wave Thursday’s 1965.99 low that has yet to complete. My target for this wave is 1997. A move below 1976.76 would invalidate this count. I am also still looking at 2019.26 as the completion of the wave from the 1074.77 low. 


Friday, September 26, 2014

Friday's Market 09/26/2014

It was a fitting end to a rollercoaster week that saw the SPX sell-off Monday, Tuesday and into Wednesday, rally sharply into Wednesday’s close, and then plunge on Thursday. Having completed a 5 wave sequence from Wednesday’s 1999.79 high at the close on Thursday, it was likely that the index would bounce at the open. It did just that, moving higher at the start of trading to 1972.16. The morning was choppy, as the SPX then fell to 1969.16, rose to 1975.69, and then moved lower again in three waves to 1969.80-1974.15-1967.92. The first three moves can be seen as Waves 1, 2, and 3 of a 5 wave sequence higher, and the last three as Waves A, B, and C of an inverted corrective Wave 4. Wave D turned out to be the bulk of today’s rally, as it drove the index higher to 1986.37. That was followed by one more pullback to 1981.07 that   completed Wave E, and thus Wave 4. If correct this would mean a continuation of the rally on Monday, with a minimum Wave 5 target of 1990.


Where this Wave 5 concludes could provide some important clues as to the next larger move. The key price to watch is Wednesday’s 1999.79 high. If this wave terminates below that level, it is likely part of a complex corrective wave from Wednesday’s 1978.63 low. This could take several forms, and possibly conclude between 1999.79 and 2019.26. If current wave concludes above 1999.79, this may be the start of a larger move to new highs. I will try to elaborate on these scenarios over the weekend.


Thursday, September 25, 2014

Thursday's Market 09/25/2014

Last Friday morning the SPX touched 2019.26, which almost likely completed a 5 wave sequence from 1560.33, and possibly a sequence from 1074.77, all of which I have been mentioning for several days. It is far too early to call the rise from 1074.77 over, so it remains best to take this one wave at a time. After hitting 2019.26, the SPX declined into Wednesday morning completing a 5 wave sequence at 1978.63. After completing that sequence, the index staged a rally into Wednesday’s close, once again completing a 5 wave sequence at the high of 1999.79. That indicated at least a pullback for today, which turned out to be an understatement.


The SPX dropped precipitously at the outset, dropping to 1970.41. This turned out to be the first wave of a 5 wave sequence that then completed at the close as 1975.79-1966.80-1972.65-1966.56. With a sequence completing today at the low, the SPX should experience a bounce tomorrow. Resistance is at 1969 and then 1977.


Wednesday's Market 09/24/2014

After completing a 5 wave sequence from 2019.26 yesterday at 1982.86, the SPX looked poised for a move to the upside. The index did start off to the upside, moving to 1986.23 at the open. However, the SPX was not quite ready to break out. After opening higher, the index fell to 1980.68. The SPX then stair stepped lower, finally reaching 1978.63. From yesterday’s 1982.86 low the SPX formed an inverted corrective wave at 1986.23-1980.68-1983.80-1980.10-1983.10. Following that the index moved to 1979.06-1981.26-1978.63, completing a higher degree sequence from 2019.26 just above the 1976 target first mentioned on Sunday.


After reaching 1978.63 the SPX did rally sharply. The index ran up quickly to 1985.23, paused momentarily, and then continued higher to 1993.08, where another pullback took the index to 1989.90. The rally continued after that, reaching a high of 1999.79 just before the close, and completing a 5 wave sequence at that point.

With the completion of a 5 wave sequence at 1999.79, the SPX may experience a pullback from here. Support is at 1988, and then 1982. The next resistance level would be 2032. The SPX appears to be at another decision point; either move to new highs, or continue the decline.


Wednesday, September 24, 2014

Tuesday's Market 09/23/2014

The SPX gapped down this morning to 1986.70. After bouncing to 1995.41 the index continued the decline, falling to 1983.80 before bouncing again. His time the SPX rose to 1988.59 before falling to the low of the day at 1982.86.


The SPX may have found at least a short term bottom at today’s low. From the 2019.26 high the index completed Wave A at 2006.59. Wave B then completed at 2014.08 and Wave C at 2001.75. Wave D was an inverted corrective wave, completing at 1995.99. Today’s action can be seen as Wave E which completed at 1982.86.

I am still looking at 2019.26 as the top from the 1074.77 low. If the SPX is to make a new high, it may do so from here. Resistance is at 1988, 1992, and then 2013. A move below today’s low would signal continued downside action.

Monday, September 22, 2014

Monday's Market 09/22/2014

The SPX started the day by gapping lower, which set the tone for the remainder of the day. After initially falling to 2001.75, the SPX bounced weakly to 2005.49, and then continued lower to 1992.11. Another slightly stronger bounce to 1996.79 followed, but was soon met with more selling pressure as the index fell to the low of the day at 1991.01. The SPX ended the day with a bounce to 1995.99, and then a fade into the close.


Looking at the SPX from the 2019.26 high the index first completed a 5 wave sequence at 2006.59 on Friday. The index followed that up with a completed sequence higher into Friday’s close at 2014.08. These likely are Waves A and B of a 5 wave sequence to the downside. Today’s opening move to 2001.75 and bounce to 2005.49 can be seen as a wave 1 and either wave 2, or A of 2. From 2005.49 a 5 wave sequence completed at 1991.01, for either wave 3 or B of 2. The bounce to 1995.99 is then either wave 4 or C of 2.

This continues to look like an incomplete sequence from the 2019.26 high. It appears that the SPX may move slightly higher from this point. A move to 1998-1999 would complete an inverted corrective wave from 2001.75. That should set up another move lower to the next support level at 1976.


Thursday, September 11, 2014

Thursday's Market 09/11/2014


Ever since the SPX fell to 1074.77 in October 2011, the index has moved progressively higher. I have been counting this sequence as Wave 1 at 1292.66, Wave 2 at 1158.66, Wave 3 at 1422.38, and an inverted corrective Wave 4 which ended at 1560.33. Given this structure the minimum target for Wave 5 was 1776, with an optimal target of 2041-2046. The SPX surpassed the minimum target last November.


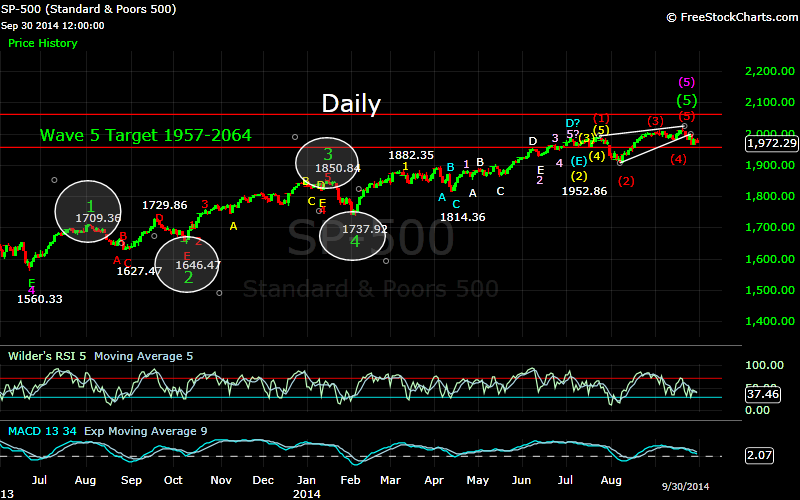
The Daily Chart shows the progress of Wave 5 mentioned above. Once again four waves of a sequence completed at 1709.36, 1646.47, 1850.84, and 1737.92. In this case Wave 2 was the complex inverted corrective wave. With four waves completed, a target range of 1957-2064 was indicated. From the 1737.92 Wave 4 low, Wave 5 then tracked fairly well into July when the SPX reached 1985.59. Wave 1 of 5 looked to have completed at 1882.35. Wave 2 of 5 then looked to be forming a complex corrective wave. Waves A, B, and C of this wave completed at 1814.36. A 5 wave sequence higher then followed which formed Wave D of 2. At this point the SPX seemed to vary from the script, as I was looking for a move lower to complete Wave E, and thus Wave 2. The lower limit of this wave projected to 1937. When the index fell to 1955.59, and then started to move higher, it looked like Wave 2 of 5 had completed. The short rally to 1991.39 was difficult to follow, and the subsequent drop to 1904.78 complicated things further. The best count for this is that Wave 2 of 5 did indeed complete at 1955.59. Waves 3, 4, and 5 of 5 then can be counted as 1968.84-1981.27-1991.39.This would mean that Wave 4 was also a complex corrective wave. This is rare, with usually only one of the corrective waves being complex, but something that is sometimes seen at the end of higher degree waves. With a 5 wave sequence completing within the target zones, it seems likely that the sequence from 1074.77 completed at 1991.39.


With the SPX having made new highs since then, the above statement seems a bit absurd. However, there are at least two scenarios in which this makes sense. First, either the wave from 1560.33 is extending, or the sequence from 1074.77 is extending. What I see as more probable is that the sequence from 1074.77 completed at 1991.39, and now the SPX is forming a complex corrective wave.  The decline from 1991.39 to 1904.78 counts as a 5 wave sequence and is likely the first wave of the corrective wave. Wave 2 is now underway, and has carried the index to new highs. This will likely form a semi-inverted corrective wave. After this wave higher completes, the SPX will likely move lower, finding support between 1991.39 and 1904.78. Eventually this sequence should complete below 1904.78.

The sequence from 1904.78 so far looks like a Wave 1 completed at 1944.90, with Wave 2 an inverted corrective wave that completed at 1982.99. A preliminary target for this wave is above 2031, but a more accurate target should be able to be calculated soon. There is a possible count that shows 2011.17 being the top of this wave, and a move below 1981 would likely confirm that.