Saturday, June 29, 2013

Friday's Market 06/28/2013

Now that was fun! It seems that whenever one side gets too comfortable, the market throws in a day that tests the resolve of both sides. Today was such a day. The Bears took the early lead, starting the day off with a gap down, and then continuing to move the SPX lower, until it reached 1607.85. A small bounce took the index back to 1610, but the selling took hold once again, and the SPX dropped back near the 1600 level, settling at 1601.06. That was all the Bulls needed to get started, pushing the SPX back up into positive territory for the day in just over an hour. This move brought the SPX to 1615.64, where the Bears tried to move the market lower. They succeeded to a point, dropping the index to 1607.38 before the Bulls came back. They moved the SPX to 1615.94, just taking out the previous intra-day high. Another push down took the SPX to 1609.38, which fell short of the 1607.38 low. The next move higher stopped short of both previous intra-day highs, stopping at 1615.49. However, just as it looked like the SPX might finish positive for the day, the index dropped precipitously in the last half hour most notably in the last few minutes of trading. This drop took out the two previous intra-day lows, but stopped short of the early morning 1601.06 low, at 1606.24.


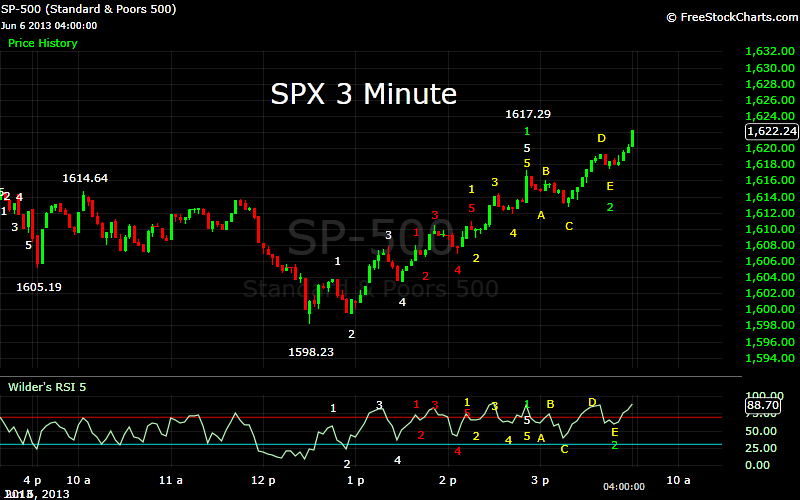
From Thursday’s 1620.07 high, I was anticipating a zig-zag like move lower, and given Thursday’s drop to 1611.94, and subsequent rebound, I was expecting this pattern to end near 1608. The initial drop to 1607.38 looked the completion of this pattern, but the drop through that level to 1601 fell outside my model’s parameters for that count, and started to indicate a more bearish count. However, the drop from 1620 to 1607 actually completed in a 5 Wave sequence, with the rebound to 1610, and drop to 1601 actually completed the pattern I was looking for, albeit at a slightly lower level than anticipated. This completed the inverted corrective wave from 1589 that I spoke of yesterday, and most likely marks a near term low.

From that point things got very interesting. First, the SPX completed a 5 Wave sequence up to 1615.64. This was followed by a series of sequences, 1607.38-1615.94-1609.38-1615.49, and finally the move down to 1606.24. Notice that from the 1615.64 high (and yes, some snicker at my choice of time frames, and affinity for precision), the SPX fell to 1607.38. The index then made a slightly higher high at 1615.94, followed by a higher low at 1609.38. The next high fell short of both the 1615.94, and 1615.64 highs. This was followed by a move down that ended lower than the 1607.38 low, but remained above the 1601.06 low. This appears to be a classic semi-inverted corrective wave, with the 1606.24 low satisfying my model for this wave, although the range was extremely tight. This development could point to a very bullish scenario, at least in the short term.

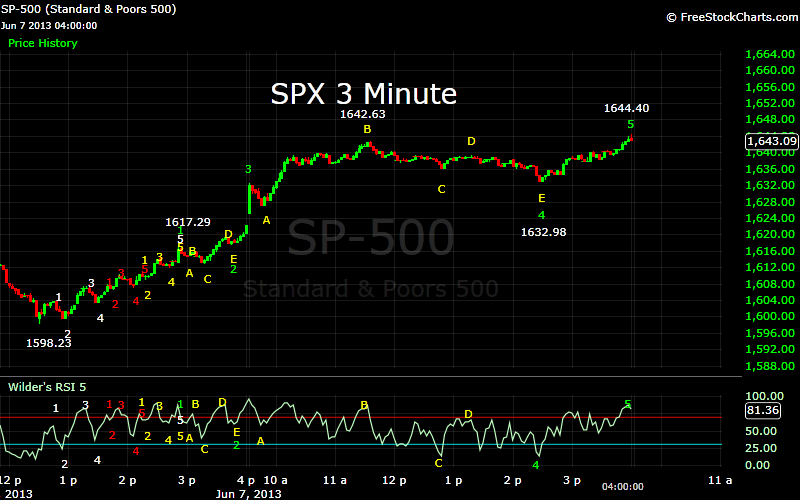
In the very near term, this wave structure points to a target near the 1631 price level that I have previously mentioned. Moves from this structure are usually swift, and I would be looking for something like 1621-1616-1631 to complete the 5 Wave sequence from 1601.


The second thing to keep in mind is the count from the 1560 low. I had been expecting 1631 to complete 5 waves from this low, but it is now more likely that 1631 will mark the completion of only Wave 3. Since Wave 2 from 1560 was a complex corrective wave, the rally to 1615.64 most likely cannot be Wave 3, since it too was followed by a complex corrective wave. In the vast majority of instances only one corrective wave in a sequence can be complex. This would point to a continuation of the move from 1560 beyond the 1631 level.

I apologize for getting extremely technical, but sometimes I feel it necessary. If you made it to this point, I thank you, and offer this alternate version. I believe 1601.06 will hold for some time. The next move should be higher, something like 1621-1616-1631. 1631 will then be Wave 3 from 1560, and after a small pullback from that point, the SPX should move higher once again to complete 5 Waves from 1560. 

Thursday, June 27, 2013

Thursday's Market 06/27/2013

It was another day, another gap up open for the market. The SPX gapped higher, and then reached 1614 before a very slight pause. After that pause, the index headed higher, hitting 1618, pulling back to 1614, and then hitting the high of the day at 1620.07. From that point the SPX pulled back, dropping to 1612, and then moving back up to 1618. After dropping to 1613, the SPX traded between that level and 1617 into the close.


Ideally I had been looking for a move lower to 1597, followed by a move higher to 1607. This would have completed Wave B of 2 from the 1560.33 low. The SPX did complete that Wave B of 2 today, but did so by rocketing straight up to 1620.07. At that point the index did see the pullback for Wave C of 2. Waves C, D, and E of these inverted corrective waves can manifest themselves as either a zig-zag pattern, or as a pattern in which Wave D surpasses Wave B, and Wave E completes without moving beyond the level of Wave C. Usually after such a strong run-up, the three waves are more apt to complete as a zig-zag, which would result in a more sustained pullback. After the SPX dropped to 1611.94, moved higher to 1618.38, and then started to move lower once again, it seemed like this pattern was underway. However, with the last pullback remaining above the Wave C low of 1611.94, both patterns are still viable. If these waves do complete as a zig-zag, Wave E should complete between 1611, and 1608. If it does not, Wave D should rise above 1620, and then be followed by a pullback of 8-10 points. Either way, I still see the market moving higher before completing a 5 Wave sequence from the 1560.33 low, and should complete around 1631.

Should this play out as anticipated, this should merely complete the first wave of a sequence that may eventually move above 1776.

 At the moment a move below 1608 would put this count in jeopardy, while a move below 1588 could mean an end to this rally.

Thank you.

Wednesday, June 26, 2013

Wednesday's Market 06/26/2013

Today’s market action was a virtual carbon copy of yesterday. A gap open to start, followed by a sharp pullback, a steady rise into the close, and a mild pullback at the close.


Today’s gap open took the SPX to 1603.58, and was followed by a pullback to 1594.94. From there the index rose steadily through the rest of the morning and into the late afternoon hours carrying the SPX to 1606.83. The index then fell back to 1603 before the close.

As I mentioned yesterday, the SPX had not yet completed a 5 Wave sequence higher off the 1560.33 low. That was evident this morning as the SPX gapped above yesterday’s high. This appears to be part of an inverted corrective wave from yesterday’s 1593.79 high. This corrective wave then completed at 1594.94. The steady rise into the afternoon then completed a 5 Wave sequence from that low, and a third wave from 1583.06.

The SPX seems to be in a nested wave structure, with a Wave 1 at 1589.13, a Wave A of an inverted corrective wave at 1583.06, and now 3 sequences of Wave B completed at 1606.83. Ideally, a move down to 1597, followed by a rise to 1607.70 would complete Wave B. At that point the SPX should undergo a more sustained pullback.

Thank you.

Tuesday, June 25, 2013

Tuesday's Market 06/25/2013

The SPX continued to rally off the 1560.33 low, gapping up this morning, and rising above 1588 in early trading. A steep sell-off from that point nearly closed the opening gap, but the buyers soon returned, and the index moved higher again, this time reaching 1589. Another dip took the SPX to 1583 before rallying again to 1593.79. The SPX then started to fall again into the close.


From Monday’s 1560 low, the SPX rallied to 1586.45, completing a 5 Wave sequence. That then became Wave 1 of a larger degree sequence which ended today at 1589.13. After moving lower in a 5 Wave sequence to 1583.06, the index then rose to 1593.79, in another sequence. It appears that the SPX has now completed 3 5 Wave sequences from the 1560 low, 1589.13-1583.06-1593.79. Given my current interpretation of 1560.33 as the low of the correction from 1687, this would mean that the SPX should continue higher. I am still looking for a move above 1598 to confirm this scenario.

The alternative is that the 3 sequences to the upside are part of a complex corrective sequence from the 1560 low. A move below 1560 would indicate that this interpretation is the correct one.

Thank you.

Monday, June 24, 2013

Monday's Market 06/24/2013

Well, it certainly looks like I missed all the excitement. Luckily, the fish in Minnesota were a bit easier to figure out than this market has been lately.


After declining to 1577.70 on Friday, and then rallying into the afternoon to 1598.31, there was hope that the correction might be over. Those hopes were dashed this morning as the SPX gapped lower, and quickly dropped to 1560.51. After a short rebound, the index fell to 1560.33 by mid-day. That was followed by an impressive rally to 1586.45, a 26 point rally, after which the SPX declined was again into the close.

Looking at the entire decline from this point, it appears that the SPX completed a 5 Wave sequence down, which may signal the end of this decline. It would now appear that 1687.18 should be treated as the high. From there, the decline to 1635.53 would be Wave 1 of the decline. The SPX then completed an inverted corrective Wave 2 at 1654.19. This sequence went 1635.53-1674.21-1598.23-1648.69-1608.07-1654.19. The three waves to the upside were 37, 50, and 46 points. The 37 point rally started from the highest point, and the 50 point rally from the lowest. Ranked by starting points, the rallies were, 37, 46, and 50 points. This proportionality is the basis of my model.

From the Wave 2 high, Waves 3, 4, and 5 completed as 1608.34-1614.02-1577.70. This completed a 5 Wave sequence from the 1687.18 high. This then became Wave 1 of a higher degree wave which completed today at 1560.33. I have been mentioning my target of 1561 for some time, and this target seems to have turned out to be quite accurate.

There is still a chance that this market may make another slightly lower low, and would look for the SPX to move above 1598.31 to confirm this as the low. I will wait to get that confirmation before looking ahead to the next move.

Thank you for your continued support.

Monday, June 17, 2013

Monday's Market 06/17/2013

It was another gap opening for the SPX, this time to the upside. This carried the index to 1642 shortly after the open, with the SPX then continuing higher in choppy trading until it hit 1646.50. An extended pullback ensued, carrying the SPX back to that 1642 level. After hitting 1642, the index headed higher once again, with the SPX making it back to 1645.32. The index started to pull back again, with that pullback quickly becoming a sell-off. The SPX dropped all the way back to 1630.34, almost erasing the gains for the day, before heading higher. A rally into the close followed bringing the SPX 1641 before it faded into the close.


The market continued it’s up and down antics, seemingly unable to embark on a sustained trend in either direction for the moment. It would appear that the SPX completed a 5 Wave sequence from Friday’s 1623.96 low today at 1645.32 and followed that with a sequence to the downside that completed at 1630.34.

Although the day to day movements of the market have been treacherous to forecast, I still believe the markets have at least one more move to the downside before it can move higher.

I will keep my downside target at 1561 for the moment, however, there are several ways this can play out, and so that target may change. I would remain short term bearish unless the SPX can rise above 1674.21.

I will be away for the next several days, with limited access to the markets. I will try to update when I can.

Thank you for your continued support.


Friday, June 14, 2013

Friday's Market 06/14/2013

The SPX opened lower today, falling to 1633.74 before trying to rally. The index rose to 1640.80 fairly quickly, but at that point the rally stalled. The SPX began to fall again, moving down to 1628.63 with barely a bounce. The index then traded in a choppy range, before once again moving lower, dropping to 1623.96. The SPX then rallied to 1631, dipped to 1626, then rallied again to 1632. After that the index slipped to 1625.13, before rising slightly into the close.


After the opening dip, the market rallied to 1640.80. This completed the move from yesterday’s 1608.07 low, moving slightly above yesterday’s high. I had mentioned that it was possible to move slightly higher, and this move still fits within the scenario I outlined yesterday. The drop to 1628.63 then completed a 5 Wave sequence from that high, which was followed by an inverted corrective wave to 1628.56. The move to 1623.96 then completed a higher degree sequence from 1640.80.

From there, it appears that the SPX moved higher in three waves, 1623.96-1630.51-1626.11-1631.55, which seemingly is the start of an inverted corrective wave. The SPX then completed a sequence to the downside, which finished slightly above the 1623.96 low.

It is still most likely that the SPX is in the third wave of a 5 Wave sequence that will complete near 1561. Support is at 1619, and then 1611. A move above 1648.69 would put this count in jeopardy, and a move above 1674.21 would invalidate it.

Thank you.


Thursday's Market 06/13/2013

You always have to love when the market throws you a curveball. After the dramatic decline yesterday, and everyone anticipating a further decline, the SPX opened slightly lower, and then headed virtually straight up.


After opening lower to 1608, the index headed higher after that, moving up to 1617 before pulling back. The next stop was 1619, and after a small pullback, 1625. Another small pullback followed, and then the SPX headed to 1639.25, with barely a pullback along the way. The index then dipped to 1635.87 shortly before the close.

The move down to 1608.07 completed a 5 Wave sequence from 1647.72, denoted by the blue “C” on the 5 minute chart, which I currently see as Wave D of 2. Because of the configuration of Waves A, B, and C, it allowed Wave E to be rather powerful, which indeed it was. This move still fits within my model’s parameters for a move lower to 1561. Wave 1 down completed at 1639.26, with today’s move higher possibly completing an inverted corrective Wave 2 from that point. Waves 3, 4, and 5 should then carry us down to the 1561 level.

Support would be at 1619, and then 1611. Should the next wave complete at 1619, there would most likely be a very small bounce before a drop to 1561. If Wave 3 moves to 1611, I would then expect a rebound to near 1623 before the move to 1561.

Although my current count would allow for a move to slightly higher levels, a move above 1648.69 would put my count in serious jeopardy, and a move above 1674.21 would mean that my current count is wrong. Given those facts it is prudent to explore the alternative at this point.

My current count calls for a move down near 1561, followed by a move higher. I would anticipate this move to fall short of the previous 1687.18 high, and be followed by another move lower, most likely carrying the market to new lows.

My alternate count would be that 1598.23 was the low of this move, and would be followed by a move to substantially higher levels. My minimum target for this count would be 1800. If the SPX moved above 1648.69, I would start considering this count, and if the index moved above 1674.21, this would most likely become my preferred count.

At the moment I still consider a move to 1561 the most likely, with support at 1619, and then 1611.

Thank you.


Tuesday, June 11, 2013

Tuesday's Market 06/11/2013

In Friday’s post I indicated my opinion was that the 1644.40 late afternoon high would be the extent of the move from 1598.23. The SPX did go on to make a slightly higher high at Monday’s open, rising to 1648.69 at the open, but it has been downhill ever since.


The SPX gapped down this morning, dropping to 1622.92, before starting to rally. That rally to reach yesterday’s close, stopping at 1640.13. From there the SPX stair stepped lower, until it reached 1636. After a small rebound, the selling accelerated, dropping the index back to 1626.99. After a seven point rally, the SPX fell again, this time falling to 1625.68 just before the close.

The wave action from the 1648.69 high has been fairly complex, but does not look like it has completed a 5 Wave sequence from that high. First support appears to be at 1617, followed by 1602. This entire sequence from 1648.69 should complete near 1561.

Thank you. 

Friday, June 7, 2013

Friday's Market 06/07/2013

It was one of those days for the market. The SPX gapped up to 1632 at the open, and after a five point pullback, moved virtually straight up to 1642.63. For the next few hours the market meandered lower, dropping first to 1636, and then to 1632.98 after a small bounce. Just as it looked like the market was ready to roll over, the bulls roared back, taking the index to a new high for the day at 1644.40.


In yesterday’s post I gave my count from the 1598.23 low as Wave 1 up to 1617.29, followed by an inverted corrective Wave 2. This indicated a further move to the upside, and I gave 1645 as a target. Working from that count, the gap up open to 1632.41 was Wave 3. Usually, if a wave 2 is a complex wave, such as an inverted corrective wave, wave 4 is a simple wave. Today was an exception, as Wave 4 appears to have been another inverted corrective wave that terminated at 1632.98. This was followed by a well defined 5 wave structure to 1644.40, completing the 5 Wave sequence from the 1598.23 low. The 1644.40 high was just shy of my 1645 target.

The double complex was interesting, as it seems the same structure occurred leading into the 1687.18 high.

Today’s high should be the end of the current move, and should also mark the end of a larger wave structure. I have an upper limit of around 1661 for this move, so it is possible that the SPX will move slightly higher. As I mentioned, I believe today’s high marks the end of a larger structure, and the market should now be ready to correct. I would have an initial target of 1593, and a secondary target of 1548. This wave does, however, have quite a large possible range, and so may be a surprise waiting to happen. It will certainly bear watching. At the moment, 1661 seems to be the critical level. Any move above that may signal a move quite a bit higher.

Thank you.

Thursday's Market 06/06/2013

The SPX moved lower at the open, falling to 1605.19, before rallying to 1614.64. This rally fell just short of the 1614.95 high I was looking for the index to surpass to initiate a further rally. After being turned back from that level, the SPX dropped to 1607, rallied back to 1614, then fell to 1598.23. At that point the SPX did stage a rally. It moved steadily higher, in a choppy uptrend, until it hit 1614.45, again, just shy of the critical 1614.95 level. After a small pullback the SPX finally broke through that level, rising to 1617.29. A small pullback followed, and the SPX moved to the high of the day at 1622.24.


The move to 1598.23 completes now completes a 5 wave sequence for this move lower. This is best counted from the 1674.21 high, as the SPX formed the sequence 1674.21-1640.05-1661.91-1622.72-1646.53-1598.23. This gives a model value of .9988.


From the 1598.23 low, the SPX has been forming a more complex sequence. Waves 1, 2, 3, and 4 of a sequence formed at 1598.23-1603.76-1599.41-1607.86-1603.56. Wave 5 of this sequence included a double extension, as Wave 1 of 5 broke down as 1603.56-1607.99-1606.52-1610.44-1606.82-1610.94. The rest of Wave 5 completed as 1606.82-1610.94-1608.86-1614.45-1611.89-1617.29. From there, it appears an inverted corrective wave is forming, which indicates that the SPX should move higher.

This move from the 1598.23 low should end near 1645. At that point the market should once again move lower.

Thank you. 

Wednesday, June 5, 2013

Wednesday's Market 06/05/2013

The market continued lower today, starting with a gap down open, and never looking back. After initially falling to 1624.50, the SPX bounced back to 1629, and then fell further to 1620.18. After another 4 point bounce, the market fell to 1615.43, which was followed by another 4 point bounce. That bounce was followed by another drop to 1609, a bounce to 1617, and then a drop to the low of the day at 1607.09. At that point the market turned choppy, trading in between that low and 1615. The SPX fell back to 1608.38 near the close.


The SPX dropped below my target level of 1616, but is now within the range for completing the sequence from the 1687.18 high. With the SPX completing a 5 Wave sequence from that high at 1608.8, and now within my target zone for the completion of this wave, I would look for the SPX to move higher from here. If the SPX moves above 1614, I would look for the index to stage a rally.

Near term support is at 1618, and the 1640. If this is the end of this wave, I would have an initial target of 1653.

It is still possible that this wave has not yet completed. Should the SPX fall below 1608, then another sequence to the downside would need to be completed. I would expect this wave to hold above 1585.

Thank you.


Tuesday, June 4, 2013

Tuesday's Market 06/04/2013

After moving above, and then below yesterday’s close at the open, the SPX found some legs, and moved to 1645.59, before pulling back. The pullback ended at 1642 however, and the index moved higher again to 1646.53. The bears took over from there, as the SPX quickly moved lower to 1638 before rebounding. Another leg down to 1634 followed, before another small rebound. At that point the bears really took over, driving the index down to 1623.62. The SPX then staged a meaningful rally, rising to 1636.80 before falling back to 1631.31 at the close.


Looking back to my weekend post, I was looking for a move below 1619 to indicate the completion of the wave from 1687.18. Although the SPX came close, it did not complete that wave as of yet. I would expect the move off the 1622.72 low to continue, most likely into the 1646 to 1652 range. At that point the move lower from 1687.18 should continue, with a target of 1616.

Thank you.


Sunday, June 2, 2013

Weekend Outlook 06/02/2013

Coming off the long holiday weekend, the market began the week on a positive note, gapping higher at Tuesday’s open, and quickly moving to 1674.21. That would prove to be the high for the week, as the market just as quickly reversed course and headed down. Following a gap down open on Wednesday, the SPX fell below Friday’s closing level to 1640.05, and then rallied into Thursday. This rally carried to 1661.91, and then failed. After a choppy open on Friday, and a small bounce, the SPX headed further south, with the selling accelerating into the close, as the SPX closed the week at its low of 1631.67.


By falling below the previous low of 1635.53, the SPX signaled that it was still in a downtrend from the 1687.18 high. Since the wave structure from that high has not yet completed, I believe this move has further to go. The question now is whether this is the start of the move down to the 1540 level, or whether this move lower will stop short of that, and stage one more rally, possibly to one more new high.

My count from 1687.18 now shows the completion of four waves, with Wave 4 terminating at 1661.91. A move below 1618 would complete Wave 5, and set the stage for a rally off that low. While that rally may lead to new highs, it is possible that it may fall short of that level. While there is a cluster of support between 1618 and 1621, and would provide a good stopping point for this move, it could end at a lower level. I would put the lower limit of this move at 1595.

By my count, the SPX needs to put in a low, and stage one more rally to finally complete the entire move from 1343.35. At that point I would expect a deeper correction, down to the 1540 level.

Thank you.


Saturday, June 1, 2013

Friday's Market 05/31/2013

I will apologize in advance, but I am a little pressed for time tonight, so I will have to be brief. I will go into more detail over the weekend, but considering that today was the day many have been waiting for, including me, I wanted to at least touch on today’s developments.

Today was the day that the SPX finally broke through the 1635.53 low, and ostensibly clear up the muddled counts of the last week and a half. However, the break of that low seems to have created more questions than answers.

I am not counting out the possibility of this now turning into a deeper correction, one that will take the SPX into the mid-1500s. However, this market has been full of surprises, and there is no reason to believe that the market is not setting us up for another one. With this in mind, I will offer a possibility of this correction nearing an end.

I present this count on the 15 Minute chart, and it would be Wave 1 at 1672.96 from 1687.18, followed by an inverted corrective wave that ended at 1674.21. Wave 3 would have ended at 1640.05 and Wave 4 at 1661.91. This would project Wave 5 at 1619.


While the trend of the market is now to the downside, it could get interesting should we see a capitulation move on Monday. A sharp sell off at the open, followed by a strong, may mark the end of this move.

Again, I am far from calling this move over, but it is something to watch for on Monday. I will follow up with a more detailed analysis over the weekend.

Thank you.