Thursday, March 29, 2012

Thursday's Market

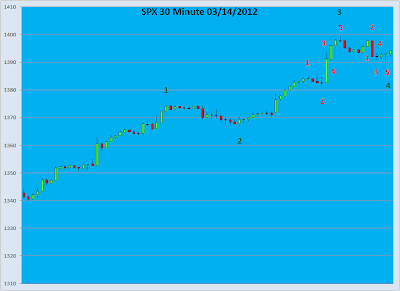
At Wednesday’s close, the SPX stood at 1405.54, right in the midst of what we identified as the termination range of a semi-inverted corrective wave from the 1398.2 low. That turned out to be the correct analysis of the wave structure, as the market opened, dropping to 1397 in the first few minutes of trading. Within the first half hour, the index hit 1394.5, completing Wave 3 from the 1419 high. A short rebound to 1398, and a final drop to 1391.56 completed Waves 4, and 5 of that sequence.

With a completed 5 wave sequence from 1419, the market was now in a position to rally. The first move was to 1394, and after dropping back to 1392, it quickly rose again to 1396. After hitting 1396, the market spent the next hour in a narrow trading range, finally finding its way down to 1393.66. From there the market rallied again, forming a 5 wave sequence from 1393 up to 1402.80. This completed a 5 wave sequence from the 1391 low, and interestingly enough marked almost exactly a 38.2% retracement of the drop from 1419. However, instead of ending the rally there, the SPX dropped to 1400, and then extended the rally through the final hour of trading. This extension of the rally was very interesting, as it also completed another 5 wave sequence from 1391, 1404.61, before fading to close at 1403.28.

Since we have completed a 5 wave sequence from the 1391 low, we can expect the market to head down once again. Should we surpass the 1404 high, we would need to form another sequence from that low. Longer term we are keeping an eye on 1419, and 1387. A breakout from either point should give an indication of the next move. At this point we still expect the market to move lower, with 1419 the termination point of a 5 wave sequence from 667. Only if we move above 1419 would that outlook change.


Wednesday, March 28, 2012

Another Move Down?

As of Tuesday’s close, we said the market had completed a 5 wave sequence from the 1419 high at 1412, with a rebound expected. If that rebound failed to carry above 1419, and then broke through 1412, we could expect another sequence to the downside.

Wednesday the market opened slightly lower, actually moving wave 5 within our model threshold, falling to 1411.65. From there the market tried to stage a rebound, rising to 1413.65. The rebound was short lived, and the SPX quickly fell back below 1412. That was our signal that the market was headed lower, and head lower it did. By 11:00AM the market had fallen to 1406, and by noon had fallen below 1400, hitting 1398 before trying to move higher. The index made it back above 1400, to 1402, before dropping once again, hitting the low of the day by 2:30PM at 1397.20. At that point the buyers took over, pushing the SPX back to 1405.67. The index dipped slightly into the close, finishing at 1405.54.

With the initial low of the day at 1411.65, the market completed Wave 1. The small rebound from there became Wave 2, with the drop to 1406 forming Wave 3. The move up to 1408, followed by the another move down to 1398, formed Waves 4, and 5, completing a 5 wave sequence from 1419.

From 1398 the market rose to 1402 in a 5 wave sequence, and followed that up with a 5 wave sequence terminating at 1397. Moving back below a wave 5 low usually signals another move down, but once the market surpassed 1402, it became clear the market was in the process of forming a semi-inverted corrective wave. Our target for this wave would be 1404-1406.5, exactly where we closed today. Should the SPX rise above our upper bound of 1406.5, our analysis of an inverted corrective wave in progress would most likely be wrong, and we could expect the rebound from 1397 to continue. A drop below 1401 would confirm our analysis, and we can expect another move lower, with another 5 wave sequence needing to be completed.


Tuesday, March 27, 2012

Tuesday's Market

The market continued yesterday’s strong move to the upside at the opening this morning. Within the first half hour the SPX hit what would prove to be the high for the day at 1419.15. From there the market worked its way lower to 1415 where it found some support. Failing to hit a new intraday high, the market made it to 1418, and then moved down once again to the 1415 level. The market tried one more time to move higher, but as it neared 1418 for the second time, it once again reversed course. This time the market came under some selling pressure, breaking through 1415. The selling accelerated into the close, with the index closing the day at 1412.52, slightly off its low of 1411.92.

Yesterday we said it appeared the index was forming an inverted corrective wave from the 1399 high, and that we were watching the 1421 level, as that would complete a 5 wave sequence from the 666 low. As it turned out, the SPX actually formed a straight forward 5 wave sequence from the 1387 low. The 5 waves turned out to be 1387-1399, 1399-1397, 1397-1409, 1409-1408, and 1408-1419. This yielded a model value of .9965, well above our .99 threshold.

While we set our target at 1421, that was the high end of our range. The 1419.35 high gives a model value of .9962. It would appear at this point that 1419 completes a 5 wave sequence from the 666 low.

From today’s high of 1419.35, the market completed a 5 wave sequence 1411.92. The expectation now would be to see a rebound from that level. Should we fail to get above 1419, and then break 1412, we would be headed for another sequence down.


Monday, March 26, 2012

When You're Wrong You're Wrong

Over the weekend we said we believed 1399 marked the high of wave 2 of a larger correction from the 1414 high, and that a move above 1399 would invalidate that count. We didn’t have to wait long for us to be proven wrong, as the market opened above that level, and continued to move higher throughout the day.

It would now appear that 1399 was a wave 1 of a larger move to the upside. The slight pullback on Friday turned out to be wave 1 of an inverted corrective wave, with wave 2 occurring at the opening today. That wave carried the market to 1412 before pulling back slightly for wave 3. Wave 4 is in progress now, with another small pullback of three to five points expected for Wave 5. That would complete wave 2 of the move from 1386, and waves 3, 4, and 5 should follow.

So now that we have made new highs for this move, it would be easy to jump into the bullish camp. In our analysis we see one more hurdle for the market to clear before we turn bullish. If we reconsider 1378 as the completion of a 5 wave sequence from the 666 low, there is a possibility of completing another 5 wave sequence slightly above where the market is today.

Using 1378 as the termination point of wave 1, the 1340 low could conceivably be wave 2. 1414 becomes wave 3, 1387 wave 4, giving us a projection for wave 5 around 1421. If the market complete a 5 wave sequence from 1387 in the neighborhood of 1421, that would complete a 5 wave sequence from the 666 low. From there we could expect another move to the downside.

Should the market move above that level, the next most likely scenario would be 1378 as the termination point of wave 1, with the drop to 1340 wave 1 of an inverted corrective wave. The move to 1414 and the subsequent drop to 1387 would be waves 2 and three of that corrective wave sequence, putting us now in wave 4. If that scenario plays out we would see another small correction after wave 5, followed by waves 3, 4, and 5 from the 666 low. This would be a very bullish scenario.

For now we will let this wave play out, keeping a close on 1421. The market should let us know where it’s heading from there. In the short term, we would expect the market to move above the current 1416 level.


Sunday, March 25, 2012

The Week Ahead

The week started out on a positive note, with the SPX hitting a new high from the 1340 low, hitting 1414.This completed a 5 wave sequence from that low, with a model value of .988. From there the index moved lower towards Monday’s close, forming Wave 1 of the down move, before edging up slightly into the close to form Wave 2. We were looking for a weaker market on Tuesday, and the SPX moved sharply lower at the open, hitting the Wave 3 low at 1397. The rest of the day was spent gaining back lost ground, with the higher opening on Wednesday; Wave 4 was completed, with expectations of the market moving lower from there. After hitting 1408 in the opening minutes, the market lost ground again, nearing 1400 before turning higher. After rising to 1407, it appeared the market had completed Wave 2 of 4, indicating another move lower. That move lower came at the opening, the SPX falling to 1389 before halting the slide. The move from the 1400 Wave 1 low, to 1389, turned out to be an inverted corrective Wave 2, followed by Wave 3. After rising to 1395, the market lost ground again to 1388.73, completing the 5 wave sequence with a model value of .982. Having finished that wave, the next move was expected to be up. After a higher opening on Friday, the market dipped below the 1388.73 low, and then rallied. This wave sequence turned out to be a semi-inverted corrective wave, with the end being 1399.18 near the close trading. From there the market lost ground to 1396, before turning slightly higher at the close to finish the week at 1397.11.

We believe the 1399 high represents the top of a correction from 1388, and we should now begin a wave 3 from the 1414 high. Semi-inverted corrective waves usually indicate substantial strength in the underlying trend, which in this case is to the downside. We anticipate the market moving lower beginning on Monday, taking out the 1388 low, and continuing to the downside as it completes waves 3, 4, and 5 from the 1414 high. Only after completing the upcoming wave sequence can the market think about moving higher once again. The first point to watch will be the 1399.18 high. Our model does not allow for a move above that level after a semi-inverted corrective wave. If that level is breached, our thesis will be wrong. If that level holds, a move below 1387 will result in a sizable move to the downside.


Friday, March 23, 2012

Reversal at 1397?


Between 1397 and 1400 the SPX will complete a 5 wave sequence from the 1392 low. That will complete a 5 wave inverted corrective sequence from yesterday’s 1389 low. Inverted corrective waves are indicative of strength in the underlying trend, which in this case is to the downside. We may now be heading back in that direction.

Thursday, March 22, 2012

Thursday's Market

Yesterday we said we did not believe 1397.68 would be the low of this down move, and set our short term target at 1393. Within minutes of today’s open, the SPX hit 1392.96. From there the market staged a short rally, moving up to 1396.95 before turning back down. The move unfolded in two 5 wave sequences, completing a 5 wave inverted corrective wave from the 1400.65 Wave 1 low. What we labeled as Wave 2 yesterday was in reality Wave 1 of that sequence. From 1396.95 the market turned lower, hitting a fresh low at 1389.22 to complete Wave 3. The market then staged another short rally to 1394.93 for Wave 4. One final session low at 1388.73 completed Wave 5, and Wave 5, setting the stage for a move higher. The market did move higher towards the close, hitting 1394.51 before fading into the close to finish the day at 1392.78.

Completing Wave 5 from the 1414 top now puts the market at a decision point. If the market is to move to new highs, this could be the starting point. We still feel the risk is greater to the downside. We would expect a more substantial move from the Wave 5 top. A breakdown below 1388.73 would now signal a continuation of the downtrend, with Wave 5 becoming the first wave in another 5 wave sequence.  Our outlook would not change unless we break above 1414.


Wednesday, March 21, 2012

Wednesday's Market

Today we were looking for a continuation of the down move from Monday. We cited the 1407.23 high as the point from which a break above would require another 5 wave sequence up. That level was breached this morning, but did so in a way that completed a 5 wave sequence from 1397.68. From 1397.68 the sequence would be, 1407.23, 1406.86, 1405.06, and 1407.61. This played out on a very small level, but does satisfy our model.
From 1407.61 we did see a move down, more in keeping with the first move of another wave down. The market completed a sequence at 1402.28 within the first hour, and then rallied to the flat line. A second move to 1401.48, and a final drop to 1400.68 y 11:00am completed Wave 1 of Wave 5.

Most of the rest of the day was spent completing what turned out to be a rather extended corrective wave. By 11:30am the market had rallied to 1404 for Wave 1, and then pulled back to 1103. Wave 3 took the SPX up to 1406, and after a drop to 1403.75, finished the sequence at 1407.20, shortly after 3:00pm.

The market came very close to making new highs at this point, but after coming within a fraction of the day’s highs, sold off into the close. We identified a minor 5 wave termination point at 1404.70, and after a feeble attempt to bounce off that level, gapped through it to the downside. That type of move is typical of an inverted wave 2. The market finished at 1402.89, down 2.63 for the day.

With what appears to be an inverted wave 2 underway, our view is the market will continue to the downside. We do not believe the 1397.68 level will be the low of the move down from 1414. Our short term target continues to be 1393. Any type of bounce from there, coupled with a subsequent back below that level, would be extremely bearish in our view.


Tuesday, March 20, 2012

Tuesday's Market

Yesterday we said we expected a sell-off on Tuesday, and we didn’t have to wait long for it to materialize, the SPX hitting the day’s low of 1397.68 within the first half hour of trading. From there the index

tried to claw its way back up to the close. From its lows, it first bounced back to 1402.52, completing Wave 1 of a corrective wave. An inverted Wave 2 was next, taking the market to 1403.92, before finishing at 1400.97. Wave 3 brought the market back to 1405.35, before giving some of it back during Wave 4, dropping to 1403.6. From there the rally continued almost to the close, bringing the market up to 1407.23. At that point our criteria for a 5 wave sequence from the 1397.68 low were met. The SPX then dipped once again in the last half hour, hitting a low of 1404.06, before closing the day at 1405.52.

It would seem that today the market completed Waves 3, and 4 of a 5 wave sequence from the 1414 high. We would project a low for this sequence at about 1393. If the market moves above 1407.23, we would need to complete another 5 wave sequence to the upside, before continuing onto Wave 5. A move above 1410 before reaching our downside target would mean 1397.68 was the low of a 5 wave sequence from 1414 that we were unable to discern. The move from that low would then be a wave 2.

1414 is still the level at which we believe a major top was put in place. If we break through that level we will have to watch the 1421 level, the upper bound of our target range for the 666 low. That would most likely mean the previous high of 1378(which was within our target range), was the actual Wave 5 top, and we have begun an inverted wave 2. For now we still feel comfortable with our current take on the market.


Monday, March 19, 2012

Wave 5 Targets Met

In Friday’s post we said we expected to move lower on Monday, looking for a target low of 1400-1401. From there we expected to see the market move higher to 1407, and then make a final low between 1394 and 1401, which would make the move from 1366.69 an inverted corrective sequence. The market did move lower at the outset today, hitting 1402.43 in the first 15 minutes. From there

the market moved higher as expected, hitting a high of 1407.16, right on our target.

The market did attempt a pullback from there moving back down to 1404.45 before moving higher once again. The failure to hit our target of 1394-1401, and the subsequent move back above the 1407.16 high, eliminated the possibility of the move from 1366.69 being an inverted corrective wave, and meant that we were indeed in wave 5 of the sequence from the 1340.03 low. That move back above 1407 was an indication that we were in a corrective sequence from the 1407.16 high. That sequence completed at 1409.70, with Waves 3, 4, and 5 quickly following, pushing the SPX to 1414.00, right at our target level for the anticipated top.

The market started to drop after hitting 1414, completing a 5 wave sequence from that top by the end of the session, closing at 1409.75. Although not visible on the 30 minute chart, at smaller time frames it appears the actual low of that 5 wave sequence was 1409.61, with what looks like an inverted correction wave developing.

An inverted corrective wave is usually indicative of a fairly sharp move in the direction of the underlying trend, which in this case is to the downside. Therefore, our expectations are for the market to experience a sell-off on Tuesday. We won’t rule out a small rebound, but we fully expect the 1414.00 high to hold. A move above the 1414.00 would necessitate a re-evaluation of the wave.


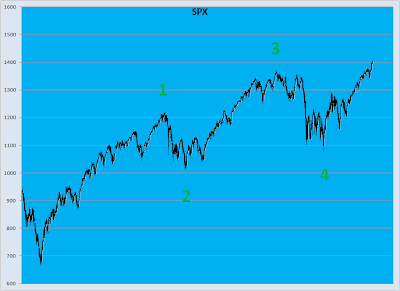
The 1414.00 level completes 5 wave sequences from 1389.97, 1340.03, 1074.77, and 666.79. We believe this completes this phase of the bull market from the March 2009 low, and expect a significant correction from here.


Sunday, March 18, 2012

Last Week's Market


After completing a five wave corrective sequence on Monday, the market moved higher into Wednesday, temporarily topping out at 1399.42. Most of Wednesday was spent developing another corrective sequence, which was completed by that afternoon. From that point the market moved higher once again, ending the week at 1405.24. We discussed our very short term outlook in Friday’s post, our expectations being that the market should bounce between 1400 and 1407, before making a short term low at 1394-1401. This would complete a 5 wave inverted corrective sequence from the 1366.69 low made on Monday. That low would be labeled Wave 2, with all waves from Wave 1 being relabeled as waves of one lesser degree. At this point, a move below the 1390 level would be considered negative, and could signal the end of the uptrend. At the very least we would then expect a further move to the downside.


With that low in place, we expect the market to then move higher, our target still being 1414-1421. That would complete a 5 wave sequence from the 1340.03 low, the 1074.77 low from October 2011, and the 666.79 low of March 2009. The market should then begin a 5 wave corrective sequence.

We believe the high at 1414-1421 will be a significant top. The ensuing corrective sequence could play out in a number of ways. There is a high probability that a Wave 2 such as this will be, will become a complex wave, either an inverted, or semi-inverted corrective sequence. Each of those scenarios would permit the market to move above the 1414-1421 level after a Wave 1 move down. We will discuss the possible scenarios in future posts.

Our long term outlook is still bullish. Although it may turn out to be, we do not believe this is part of a larger corrective sequence from the all time highs.

As many of you are practitioners of Elliot Wave in one incarnation or another we would like to at this point re-iterate that we are in no way trying to represent these as Elliot Wave counts. Our model is not rooted in Elliot Wave Theory, and none of our work is based on any Elliot Wave tenets. Our model is strictly based on a specific mathematical relationship between waves that manifests itself at the termination point of any given five wave sequence. Our model is designed to identify when a wave sequence is ending, and when a trend reversal is likely to occur. Our model does not determine the wave degree, nor does it give any indication as to where the next five wave sequence will terminate.

Having said that, we do not believe that the two are necessarily mutually exclusive, but rather two approaches to trying to understand one underlying phenomenon. During wave construction Elliot Wave, and the 5 Wave Model will exhibit much different wave counts. We have noticed, however, that the two do converge at important turning points. For Elliot Wave counts we will defer to Tony Caldaro, http://caldaro.wordpress.com/author/oewcaldaro/. He has elevated Elliot Wave from an art to a science, more aligned with our thought process. Tony’s track record speaks for itself, and we have great respect for the work he has done.

At the moment our two outlooks on the market seem quite different, but it is entirely possible for oncoming waves to unfold in a manner that would satisfy both approaches. The real value may be in examining the future implications of each, perhaps giving a clearer understanding of what may be in store, and giving a means of recognizing trend reversal points as they occur.

Take, for example, our current outlooks. Both are indicating an imminent trend change, the only difference being the degree of that trend change. Our model allows for both an inverted, and a semi-inverted, corrective eave. Either of these could result in a wave structure that conforms to both Tony’s OEW count, and our 5 Wave Model. However this wave progresses, we trust that our model will identify the key turning points.

Friday, March 16, 2012

Friday's Market


In Thursday’s post we stated the afternoon’s low of 1398.82 marked the termination point of a corrective Wave 2, and that we should see the market move higher on Friday. We didn’t have to wait long for confirmation of that call, with the market gapping up at the open, and hitting 1405.82 in the first half hour. After that, however, the market turned lower, eventually dropping below yesterday’s close, before turning higher once again. The market made steady, if not spectacular, progress into the afternoon, and completed a 5 wave high from the 1398.82 low at 1405.88. The market then moved lower into the close, possibly completing 4 waves of a 5 wave sequence before closing at 1404.17. For the day the SPX was +1.57, or +0.11%.

It appears that the choppiness of Friday’s session may carry into Monday, at least at the outset. It does not appear that we have completed a 5 wave sequence from the 1405.88 high on Friday. A move back down to the 1400-1401 level would complete that sequence. That would complete Wave 4 on the 30 Minute chart. Given that 4 wave structure, Wave 5 would project to about 1407. As labeled, this should be Wave 5, but it does not satisfy our model’s criteria for a 5 wave sequence. A move down from that 1407 level to 1394-1401 would meet the criteria for a 5 wave inverted correction from the 1374.76 Wave 1 high. Waves 2, 3, 4, and 5 would then be re-labeled Waves 1, 2, 3, and 4. The ensuing move to 1394-1401 would then be Wave 5, and Wave 2. Once we reach that level, we can begin moving back up to our target range of 1414-1421 for Waves 3, 4, and 5. That will complete the 5 wave sequence from the 666 March 2009, and begin a 5 wave corrective sequence.

A lot of information I know. To summarize, we are looking for a move down at Monday’s opening to 1400-1401, a move back up to 1407, and then one final move down to 1394-1401. From there we look for a last move up for this rally to the 1414-1421 level.

We are already in the topping range for the 5 wave sequence from 666, and are only waiting for the last few minor waves to complete, so we urge caution.


Thursday, March 15, 2012

Thursday's Market - How Much Higher?

With the SPX completing Wave 4 yesterday afternoon, we were looking for a move higher today. The initial move up from those lows yesterday afternoon turned out to be the first wave of this move up. The market did move higher initially, hitting 1396.61 in the first half hour, before turning lower. There was some choppiness during the morning, as the market formed an inverted corrective wave from that initial move, completing that at 1393.74. From there the market turned higher once again, completing Wave 3 at 1398.76, just shy of the Wave 3 high of 1399.42. A short pullback to 1395.37 formed Wave 4. From there we were looking for a projected move to the 1400.5-1402.5 level for Wave 5. During the midday hours the SPX hit 1402.35, completing Wave 5.

From that high we moved lower once again to 1398.82. This completed a 5 wave sequence which would either become Wave 2, Wave 1 of an inverted corrective wave, or possibly Wave 1 of a larger corrective wave. From that point the market moved higher again into the close, finishing the day at 1402.60. The move above the Wave 1 high of 1402.35 indicates 1398.82 would be the low of this minor correction, and we would be looking for another move higher. The move today puts us well within striking distance of our target range.

In the very near term we are in Wave 2 or 3 of the move from 1389.97. This wave should complete all higher degree waves from the 666 low.

In the short term we are in Wave 5 of the rally from 1340.03. Our target for this wave is 1414-1429.

Medium term we are in Wave 5 of the 1074.77 low. This wave should terminate between 1398 and 1428.

Long term, again, we are in Wave 5 from the 666.79 lows of March 2009. Our target for this wave has been 1378 to 1421.

Looking at the market from the 1340.03 low, we are in Wave 5, which we project to terminate between 1414.45 -1429.92. As we move deeper into this wave, we should be able to narrow our projection. Our projection for the top from the March 2009 low remains 1378.79-1421.75, exactly where we sit now, the current wave should terminate in the range of 1414.45-1421.75.

Our wave count from the 1074.77 low has been troublesome since the initial reaction to the 1378.04 high. That reaction was not as we anticipated, and we have been unable to identify a future scenario that would satisfy our model given our current wave counts. That, plus the fact that the current wave, and the 5 wave sequence from the 666 low, are both converging on the same point, makes it obvious to us that we have erred, either missing a wave, or misinterpreting a wave. We have identified a wave structure from the 1074.77 low, which would also project into the same level. The range for that count would be 1398-1428, exactly what we would expect. At this point that seems a more reasonable count. We are continuing to re-evaluate that wave to understand the minor waves, and the complete structure of the wave.

However, we are still quite convinced that we in the range of a major top, with the completion of a 5 wave structure from the March 2009 low of 666.79 imminent. All wave degrees are converging on the same point, giving us confidence on this viewpoint. With only minor waves left to complete, it looks like this major wave will top between 1414 and 1421. From there we can expect a major move down to begin the next wave 2.

Wednesday, March 14, 2012

Wednesday's Market

Yesterday we stated that despite the exceptional strength of Tuesday’s market, we felt there was still some upside potential, setting our target for Wave 3 between 1397.27 and 1401.54. After a flat open, the market moved steadily higher over the first hour until it hit 1399.42. After reaching our target range, the market turned lower as expected.

Over the next three hours the market moved to the downside, hitting a low of 1393.13, and finally completing a convoluted but none the less correct five wave sequence at 1395.39, forming wave 1 of the correction. After a minor rally to 1397.83, wave 3 terminated at 1390.50, and wave 5 at 1389.97, completing the shallow correction we spoke of yesterday. The market came off the lows into the close, ending the day at 1394.28.

The 5 wave sequence from 1399.42 to 1389.97 should be Wave 4, setting us up for a Wave 5 termination point between 1414.45 and 1429.92. A rather large range at the moment, but as the wave develops we should be able to narrow it down further. Should we break through the 1389.97 low, we would need to complete another 5 wave sequence, and revise our target.

From there we should see another move down near 1340 before making one last move back up to the 1420 level.


Tuesday, March 13, 2012

SPX 1400?

The Stock Market created another very interesting day. Within the first half hour it took out the 1374.76 short term high, indication another 5 wave up sequence was in the works, and the previous longer term high of 1378.04. As we discussed, breaking the 1374 level made it apparent we would take out the 1378 high. From there the market continued to gain strength, hitting 1384.75 before taking a short breather. After pulling back to 1381.23, the market charged ahead once again, first to 1393.41, and then a final push propelled the market to 1396.13. Having pulled back from that level only slightly, the market closed at 1395.95.

We revised the count for the correction from the 1374.76 high. It now appears the termination of that correction was 1366.69. With the market movement today, that would appear to be Wave 2 from the 1340 low. The next termination point at the moment would be in the 1397.27 – 1401.54 range. That would complete Wave 3 of the current move. From there a small pullback would set this up sequence to finish near 1420. That would complete Waves 4 and 5, of the current sequence, and Wave 4 on the daily chart. This scenario would keep us in our forecast range of 1394.91 – 1422.88 for the top from March 2009. Wave 5 would be down, with one final run higher to complete that top.

On a cautious note, the market now sits just above a range that would have completed a 5 wave sequence from the 1340 low, completing Wave 4. If the market falls below 1391 before reaching our 1397-1401 range it would most likely validate that count.


Monday, March 12, 2012

Monday's Market


The market trade in a narrow range today, after topping out at 1374.76 on Friday. Today’s action confirmed that mark as at least a near term high. Today continued the counter trend move from that high.

The movements over the last two trading sessions has been complex if not volatile, tracing out a series of 5 wave sequences. The majority of Friday’s session was spent completing Waves 1, and 2. Having completed Wave 2 near the end of the session, the market headed down once again with Wave 3. It took the remainder of that session, and all of Monday’s session to complete that wave. Wave 1 of Wave 3 was a seemingly minor move, but Wave 2 turned out to be an inverted corrective wave that took the market lower. After finishing Wave 2, Waves 3, 4, and 5 quickly followed suit, completing Wave 3 near the end of the session.

With Waves 4 and 5 remaining in this sequence, we can expect the market to move higher, perhaps to the 1373 level, before putting in a final low for this sequence. We look for that low to be around the 1362 level.

It is possible that Wave 2 is the inverted correction, ending at 1372.25. Wave 3 would then terminate at 1370.45, Wave 4 at 1372.29, and Wave 5 at 1370.25, completing the 5 wave move from 1374.76. This scenario falls just short of our criteria, but being a larger degree wave it would take precedence over the previous count count. If we take out the 1374.76 high, this would be the correct count, and we would be in another 5 wave move up, likely taking us above the 1378 recent high.

From there we will have to look at the market for direction. We believe 1374.76 completed Wave 4 on the daily chart, so we would look for a small rally before heading back down to test the 1340 low. If we break through that level, we would need to complete another 5 wave sequence that could take out the 1378 high before heading lower.