Wednesday, March 29, 2023

Tuesday Update 03/28/2023

 SPY opened to the downside this morning, and continued lower most of the day. We can count a 5 wave sequence from yesterday's early morning high as (398.92, 395.56), (398.27, 394.97), (396.21, 393.69), with an R^2 value of .993304. This sequence completed above our targeted range of 391.5-390.7, which increases the probability that the overall wave may be more complex than originally anticipated. 

There are several scenarios at this point, and so it is more relevant to point to levels of interest than describing those options. 391.5-390.7 remains a target on the downside. We can now estimate a range on the upside of 397.6-398.3. Once again this is a very narrow range that is more easily broken to the upside. A move above this level would point to a further upside move with an initial working target of 404-408.

Should the 397.6-398.3 level hold, this still remains a bearish count.

Thank you for your continued support.

Monday, March 27, 2023

Monday Update 03/27/2023

 Since I have been following the wave from last Thursday's 390.54 low, I will begin from there. Over the weekend I had set a target for the completion of this wave between 395.7 and 398.2. The wave ultimately completed in a different fashion, and so my target was slightly off. 


Here we can see that from that low, SPY completed Wave A at 394.77. Wave B completed at 389.40, and Wave C at 392.52. Wave D was a complex wave that finally terminated at 393.04. We can the see Waves 1, 2, and 3 completing into Friday's close. The slight pullback from Wave 3 into the close became Wave A of a inverted corrective Wave 4. Thus SPY opened to the upside, reaching 398.68 before a slight pullback as 397.88-398.17-397.41. This, combined with the slight pullback into Friday's close, completed Wave 4. SPY made one more move higher, this time to 398.92, which completed Wave 5. This sequence completed as (393.04, 395.14), (394.05, 395.84), (397.41, 398.92), with an R^2 value of .99773. From that point SPY traded in a narrow range between that high and 395.56.

The completion of the 5 wave sequence this morning in turn completed Wave E(Purple), and thus Wave D(Green). This sequence can be seen completing as (390.54, 394.77), (389.40, 392.52), (393.04, 398.92), with an R^2 value of .99818.


The completion of Wave D brings us back to the count we have been watching for some time. The target implied by the four completed waves would be between 391.5-390.7. This would then complete Wave D(Red), and and imply lower prices, possibly testing the previous lows. Should this scenario play out, it would look something like a move into the 391.5-390.7 target area, followed by a bounce which could be slight, and then a move below the target area. 

At this point, two alternate scenarios may emerge. The implication of the current structure is bearish. One way to reverse this bearish course is to now break above the Wave D high of 398.92. This would set up a bullish scenario.

That would be the first alternate, with the second alternate pointing to an even more bearish scenario. The target I mentioned for this wave is quite narrow, and in many cases this allows for a "jump" of the target. In essence moving below the target area in this case. This would point to Wave D(Green) being only the first wave of an inverted corrective wave which would carry SPY even lower.

Again, it is difficult to try and get too far ahead of this market. I will continue to closely monitor the situation. The key points for now are the 398.92 high on the upside, and the 391.5-390.7 target on the downside.

Weekend Update 03/26/2023

 Beginning this discussion with the count from Thursday's 3:00pm low, SPY looks to have completed four waves of a sequence to the upside. In technical parlance this would be described as an expanding triangle, and my model gives a Wave e target between 395.7-398.2.

For the last few days I have been discussing the re-emergence of a scenario I had relegated to alternate status that now seems to be playing out. As a quick recap, I have counted three waves down from the February 2nd high of 418.31. I had then completed a count showing the March 13th low of 380.65 as the completion of a 5 wave sequence from that high. The alternate scenario entails some complex corrective waves forming from the Wave 3 low. The structure of these corrective waves consisted of the third wave of the correction being longer than the first, and the 4th wave terminating lower than the origin of the first wave. The structure from the Wave 3 low, into the March 13th low contained two such corrective waves, with one possibly having completed Thursday at 399.29. These corrective waves have a very bearish connotation unless it reverses itself and moves above the high of the third wave.


Counting from Wave 3(Red), the chart shows three waves up, labeled as Waves A - B and C. From there we have a move down to what I have labeled as Wave A(Green). Originally I had labeled that as Wave D(Red), which may still be the best count. That would infer a move below 377, which would be Wave 4(Red) from 418.31, with Wave 5 to follow. 

The count displayed above would be even more bearish. Taking into account my current target for the current short term wave of 395.7-398.2 would indicate a move below at least 359, depending on the exact termination point of the wave.

Another possibility is that Wave B(Green) is actually a wave A. This would allow SPY to move above the critical 401.48 level, and perhaps reverse the negative connotation of the current wave structure.

We now have some clear levels to watch. If the current short term wave does terminate between 395.7-398.2, and is followed by a move below 390.54, we could see much lower prices in the near future. A move above 401.48 could negate the current scenario.

Your donations help make this analysis possible. We appreciate your continued support.

Friday, March 24, 2023

Friday Update 03/24/2023

 SPY saw a gap down this morning, opening at 391.98 and falling to a low of 389.40 in the first 20 minutes of trading. The rest of the morning was spent bouncing between that low, and 393. SPY closed the opening gap slightly after noon, and after a small pullback continued steadily higher for the remainder of the day. After hitting a high of 395.84 in the last hour of trading, SPY saw a small pullback before rallying into the close and finishing the day at 395.75.


So far this looks like a corrective sequence from yesterday's Wave 5 low I mentioned yesterday. SPY may be in Wave 5 of that corrective sequence, with a target between today's high, and possibly 398-399. There are a couple of longer term scenarios that I will address in detail over the weekend. The alternate count I have been mentioning the last couple of updates still seems to be in play. Where these next few waves complete could have a major impact on the targets, so I will try and work through some of that also.

Your contributions help support this analysis, and is very much appreciated. Thank you.

Thursday, March 23, 2023

Thursday Update 03/23/2023

 In Wednesday's Update, I stated SPY had completed a 5 wave sequence from Wednesday's high, into the Wednesday afternoon low. I also gave supporting evidence for the 392.07 low as a likely stopping point, if only for the moment. I then said to expect a rally above 399.

SPY did open to the upside, and continued higher until just after 11:00am. This move completed in a 5 wave sequence, (392.07, 397.21), (396.29, 398.51), 398.11, 399.29), with an R^2 value of .993265. This sequence completed just over the 399 level I targeted, which would complete a Wave E of the alternate scenario I discussed yesterday, with yesterday's low being Wave D. 

After reaching that high, SPY turned lower, completing a 5 wave sequence to the downside just before 3:00pm, just above 390. This sequence went (399.29, 397.13), (398.02, 394.75), (396.20, 390.54), with an R^2 value of .996803.

SPY rallied off that low, making back to 394.77. Another move lower to SPY to the low of the day at 390.35, before rallying again to 394.99 shortly before the close.


We seem to be at a critical juncture. A few scenarios point to another run up to near 400 from this point. If that plays out, we may indeed be in this narrow trading range a bit longer. A significant break below the 390 level probably points to a re-test of the lows.

Your support is appreciated.

Wednesday, March 22, 2023

Wednesday Update 03/22/2023

 In Tuesday's Update I wrote this:

"The initial move today to 398.34 met the requirements to complete Wave 5(Tan), and Wave D(Green). The following pullback to 395.58, while slightly less than the ~5 points I had mentioned, then met the requirements for Wave E(Green), and Wave 4(Green). Wave 5(Green), and the completion of the 5 wave sequence from the March 13th low, then projects to complete between today's late afternoon high, and 418. This would imply that the market is reaching a short term high."

SPY opened flat today, trading in a narrow range between 397-400 while it awaited the Fed announcement. When that came, volatility increased, and the initial reaction seemed to be positive. SPY ran up to 401.70 immediately following the announcement, but quickly dropped back to 397.40. SPY rallied again, this time to 402.49. That was to be the high of the day, as SPY soon fell to a new daily low at 395.67. A rally from that point soon evaporated, as SPY rose to 399.89 before starting a precipitous decline into the close, finishing the day at 392.07.

As it appears SPY has put in a short term top at today's high of 402.49, I can complete the count from the March 13th low of 380.65.


SPY completed three waves up from that low, at 387.31, 383.65, and 390.39. These are labeled Waves A, B, and C in green. Wave 4 then broke down as an inverted corrective wave, with Waves A, B, and C completing by the 15th. Wave D can then be seen subdividing as Waves 1-5 in tan. This completed as (383.71, 386.57), (388.55, 394.17), (390.73, 398.34), with an R^2 value of .99763. The subsequent drop to 395.58 was Wave E, with Wave 4 completing as (390.39, 385.36), (389.50, 383.71), (398.34, 395.58), with an R^2 value of .99682. The rise into today's high of 402.49 then completed the fifth wave of the entire 5 wave sequence from 380.65 as (380.65, 387.31), (383.65, 390.39), (395.58, 402.49), with an R^2 value of .99999. I have similarly documented most of the smaller waves throughout this sequence in my Daily Updates for those interested.

If this move down is merely a correction of the just completed sequence, we can make some projections. The first projection for a corrective wave suggests a move to between 390.7 - 392.5 with today's low of  392.07 within that range. This projection is based on the start point of the previous sequence, 380.65, the completion point of the sequence, 402.49, the previous high before the completion point of the sequence, in this case Wave D(green), or 398.34, and the correction low. It can be found by solving for (380.65, X), (X, 398.34), (398.34, 402.49), where "X" is the correction low.


Looking at the decline from today's high, we can see three waves down with the third wave subdividing. That subdivision so far is (399.89, 398.00), (399.27, 396.32), (397.43, 392.07). That has an R^2 value of .99887, so if today's low holds, we could see a move higher.


There is one final interesting thing about the decline from today's high. I have been looking at the March 13th low as the completion of a 5 wave sequence from the February 2nd high of 418.31. I did have a more complex count originally, especially concerning the last set of waves going into Wave 5 of that sequence. I originally had the move up into Wave 4(Purple) as three waves. The move into Wave 5 made this a particularly bearish scenario. I had relegated it to alternate status given the recent run-up, but today's action brought it back into play for the moment. The important part at the moment is the move into Wave 5, or alternately, Wave A?. The recent run-up would then be Wave B?. The three wave decline into today's close can then be seen as (393.16, 380.65), (402.49, 395.67), (399.89, 392.07), with an R^2 value of .99826. This count would suggest a move above 399 from today's low. Although originally a bearish scenario, this may now point to continuation of trading within the recent range.

For now, a move below 390.7 would be short term bearish. We may see a bounce from today's low. If we do, a move above 399 seems to point to more volatile swings up and down as we reconcile some of the previous wave structure. Depending on the structure, it may also mean a fresh move to the upside is underway. A bounce below 399, followed by a move below this recent low would also point to a more bearish scenario,

Help support further research.


Tuesday, March 21, 2023

Tuesday Update 03/21/2023

 In Monday's Update I said I was looking for SPY to move up to the 397-399 level, and then pull back by approximately 5 points. After closing at 393.67 on Monday, SPY gapped up this morning right into that 397-399 range, opening at 397.30. It reached a high of 398.34 just after 10:00am, before pulling back to 395.58 shortly before noon. Shortly after 1:30pm SPY was back up to 397.42. By 2:00 it had pulled back to 396.24, but then rallied strongly into the close, coming close to the 400 level at 399.41 before closing the day at 398.88.

Your contribution makes this analysis possible.


We have been following the wave sequence from March 13th low of 380.65.


The initial move today to 398.34 met the requirements to complete Wave 5(Tan), and Wave D(Green). The following pullback to 395.58, while slightly less than the ~5 points I had mentioned, then met the requirements for Wave E(Green), and Wave 4(Green). Wave 5(Green), and the completion of the 5 wave sequence from the March 13th low, then projects to complete between today's late afternoon high, and 418. This would imply that the market is reaching a short term high.

While today's action met the requirements for the completion of the above waves, the short term wave structure counts better as a single wave from yesterday's Wave 4 low. This could mean that Wave 4 did not terminate yesterday afternoon, but is itself forming an inverted corrective wave that has yet to complete. This would point to higher prices still to come.

Your support is appreciated.

Monday, March 20, 2023

Monday Update 03/20/2023

 In Friday's Update I outlined the start of what appeared to be a bullish sequence beginning from Friday afternoon's low. This sequence played out this morning as SPY opened with a gap to the upside, opening at 391.21, and then continuing higher to 391.85. SPY then entered a consolidation pattern, trading between that high and 390.07, which closed the opening gap. SPY then moved  to a new intra-day high at 392.69, before pulling back to 391.16. From that point, SPY showed continued strength nearing mid-day, and hit a high of 394.17. Once again SPY pulled back, falling all the way back to 390.73 before regaining strength heading into the close. SPY made it back above 394 before pulling back slightly to close the day at 393.67.

Your contributions make this analysis possible.

Saturday, March 18, 2023

Weekend Update 03/18/2023

 The week started on a bearish note, with SPY gapping down Monday morning to 380.65. This set up a bullish divergence on the RSI(5) for both the 15 and 60 minute charts. The gap down was followed immediately by a reversal and a fill of that opening gap. The rally off that low continued into Tuesday, where a reversal to the downside carried into Wednesday, and brought SPY back down to 383.71. By mid-day Wednesday SPY was on the upswing again, lifting it to 396.47 just before Thursday's close. SPY finished the week with a gap down, and this time the bearish sentiment carried into the close. SPY closed the week at 390.12.


The current count from Monday's low has SPY in Wave D(Purple). This wave is itself sub-dividing, with an inverted corrective Wave 2 possibly having ended Friday. This would put SPY in Wave 3 of D. My working target for the completion of the wave Monday's Wave D low is above 404.


On the 60 Minute chart, we can follow the sequence from the 418.31 high. Wave 1 terminated at 407.57, and was followed by an inverted corrective Wave 2. This completed as (407.57, 416.49), (405.01, 415.05), (392.33, 407.45) with an R^2 value of .99992. Wave 3 then completed at 396.59. From that point, things became slightly more complicated. I have been counting the bounce off the Wave 3 low as having occurred in three waves, which would have a very bearish connotation as I discussed last weekend. Until SPY breaks above that high, which was 401.48, that bearish scenario is still in play. But if the current shorter term count plays out, that high will be exceeded, so there is an alternate count to consider.


There is a count that has an inverted corrective wave completing between the Wave 3 low and 393.16, which would be Wave 4. The 380.65 low would then complete the sequence from 418.31 as (418.31, 407.57), (407.45, 396.59), (393.16, 380.65), with an R^2 value of .99925.

Friday, March 17, 2023

Friday Update 03/17/2023

It was another gap down opening for SPY. It opened at 393.12, and spent the first hour and a half bouncing between 392.24 and 394.40. That was followed by the most damaging move of the day, taking SPY down to 388.56. The remainder of the day was spent in a narrower range between that low and 391.78, although a very slightly lower low was made late in the day at 388.55. 


From yesterday's late afternoon high, we can count the initial move lower to 392.24 as a Wave 1. Wave A of an inverted corrective move occurred soon thereafter at 394.40. Wave B, as is often the case, was the most damaging move of the day. It subdivided into a 5 wave sequence of it's own, which we can count as (394.40, 392.38), (390.98, 389.01), (390.25. 388.56), with an R^2 value of .9967. Waves C, D, and E carried us to the afternoon high of 391.78. This completed Wave 2 as (392.24, 394.40), (388.56, 390.18), (389.76, 391.78) with an R^2 value of .99646. Waves 3, 4, and 5 then carried SPY to the late afternoon low of 388.55. This completed the 5 wave sequence from yesterday's late afternoon high as (396.47, 392.24), (391.78, 389.9), (389.63, 388.55) with an R^2 value of .9967.

Once that low was put in, SPY seems to have managed some constructive work in the last hour. it appears to be the beginning of a sequence that has started with a Wave 1 at 390.05 followed by an inverted corrective wave (390.05, 389.20), (390.87, 389.60), (390.52, 389.44), which has an R^2 value of .99906. If this count proves correct, it implies a move higher.


Widening out to look at the last two days, we can now continue the count from Wednesday's low. From that low, SPY completed two waves higher Wednesday afternoon, and began a fourth wave that terminated Thursday morning. After hitting that low, SPY began yesterday's very strong move to the upside. The move occurred in a 5 wave sequence as (386.29, 394.45), (392.40, 396.14), (393.62, 396.47), with an R^2 value of .99999. Count the first wave off Wednesday low as Wave 1, followed by Waves A, B, and C, yesterday's move becomes Wave D. The sequence from Wave 1 to today's low becomes, (386.57, 385.44), (389.49, 386.29), (396.47, 388.55) which has an R^2 value of .99945.

This count implies that SPY is still in the sequence that started on Wednesday, and is in Wave C of that sequence. Following the completion of this sequence, I would still expect the approximately 5 pint decline I talked about yesterday. So we may be in a trading range waiting on the Fed decision. Time will tell.

I will update some of the other wave structures over the weekend.

Thursday, March 16, 2023

Thursday Update 03/16/2023

 SPY gapped down at the open, moving lower to 386.29. From there we saw some sideways action, with SPY moving between yesterday's close, and the opening low. Just before 10:30am, SPY began to move higher, reaching 394.45 before noon. After a slight pullback, SPY moved to 396.14. From there we saw mostly sideways action with SPY hitting a new high for the day at 396.47 shortly before the close, and closed at 396.04.


We have now seen a considerable rally off the Wave C low I identified yesterday. As I stated yesterday, once this wave completes, we should see a pullback near the magnitude of Wave A, which was ~5 points. This should then be followed by another wave higher to complete Wave 5 from the March 13th low.

Your support is appreciated.

Wednesday, March 15, 2023

Wednesday Update 03/15/2023

 It was another volatile day for the markets. SPY gapped down at the open, moving back to 385.70. It then bounced back to near 388 before falling once again. First to 385, and then 384.31 after another bounce. That once again found support, and SPY rallied back to 387 before falling to the low of the day at 383.71.

As has become the norm, SPY rallied in the afternoon, rising to 389.49 before falling back to the 387 level. But a rally in the last few minutes brought SPY back to near the high of the day, closing out the session at 389.36.


Before discussing today's market, I will first say I miscounted the last move up from yesterday. It was a 5 wave sequence that went (387.05, 388.46), (388.90, 390.64), (389.88, 392.18), with an R^2 value of .99414. Having done that, I will continue with today. If yesterday's last sequence was a Wave A, we can see the initial gap down, and subsequent choppiness can be counted as a 5 wave sequence, finishing Waves B, C, D, and E. (387.05, 392.18), (385.70, 387.16), (385.72, 387.72), with an R^2 value of .99209. Following that, we can count a 5 wave sequence into the day's low as, (387.72, 386.02), (387.44, 384.31), (387.37, 383.71), with an R^2 value of .99606.


Next I will widen out the view. This shows the wave I have been following from the Monday low. As we can see Waves 1, 2, 3, A, and B, remain the same. I had counted the low on the 14th as Wave C, but with today's action, the entire move from the Wave B high, to today's low can be counted as a semi-inverted corrective wave. This went (389.50, 385.05), (393.45, 387.05), (387.72. 383.71). This sequence has an R^2 value of .9897, slightly below the threshold of .99. However, it misses the threshold by .01. Using 383.72 as the end point yields .99011. Given the closeness, I will consider it within the margin of error, or slight misreading of the smaller waves. But this seems the best count.

This leaves us in Wave D, which is moving higher. Once this wave completes, we should get a move lower, with a magnitude similar to the Wave A decline. That would conclude Wave 4, with another move higher for Wave 5.

With the current volatility, and uncertainty surrounding the market, things can change quickly. 

Tuesday, March 14, 2023

Tuesday's Update 03/14/2023

 SPY gapped up this morning to 390.44 off yesterday's low of 385.05. The rise continued into midday, with SPY reaching a high of 393.45. After attaining that high, SPY gave back some of the gains through the afternoon, hitting a low of 387.05 after 3:00pm. From there SPY rallied again, finishing the day at 391.68.

If we look back at yesterday, a short term count becomes apparent.


From yesterday's early morning low, we see SPY rose in three waves to 390.39 Following that, we see a three wave decline to 385.05. Those waves can then be counted as Waves 1, 2, and 3, followed by three waves, A, B, and C of an apparent inverted corrective wave. This implies a move higher, followed by a decline. 


This morning we saw SPY rise in a 5 wave sequence, (385.05, 391.92), (390.37, 392.99), (391.90, 393.45), with an R^2 value of .99313. This move took us to 393.45, just slightly above the 393.16 high I talked about yesterday. This indicates the bearish count could be reversing itself. There are still a number of ways this could go, but for the moment it looks like the SPY has avoided the immediate move lower.

After that high, SPY moved lower, forming a Wave 1 at 392.01. From there we saw an inverted corrective wave, (392.01, 392.74), (391.57, 392.51), (388.35, 390.53), with an R^2 value of .9995. That completed Wave 2, and the entire sequence from 393.45 as (393.45, 392.01), (390.53, 387.71), (390.00. 387.05), with an R^2 value .99959. The rise from there can be seen as a Wave 1, followed by an inverted corrective Wave 2. 


Looking at the two days together, we can see that today's completed Wave D of the inverted corrective wave, and today's low Wave E, and thus Wave 4 from yesterday's low. With four waves completed, we can now project Wave 5 to complete at 393-395. 

Thank you for your support.

Monday Update 03/13/2023

 SPY gapped lower to start the week, opening at 381.93 and then falling further to 380.65. SPY then rallied off that low, moving into positive territory, and reaching 387.31. That was right at the 387-390 resistance level I mentioned over the weekend. SPY gave back some of those gains, dropping back to 383.65 before once again moving higher, this time to the upper edge of that resistance zone, topping out at 390.39. The rest of the session was spent in consolidation mode, as SPY fell back near 385 before trying to test the 390.39 high. It fell just short at 389.50 before falling back near 385 and closing at 385.31.

This is the chart I posted in the Weekend Update:


With this morning's opening decline I made some adjustments to the count for the last two hours of trading.


The count from the high just past 2:00pm turned out to be much more complicated than I originally thought. I will not detail the entire count, but it makes this morning's low the end of a 5 wave sequence that began with the 2:00pm high.

I noted over the weekend that I sometimes place an "X" at the termination points of waves until the count becomes clear. That count did become clear with this morning's low, and I have noted those counts. The first three waves from the Wave D low to the left of the chart became Waves A, B, and C. From Wave C, a 5 wave sequence ensued, terminating with this morning's low, completing Wave D.

In my discussion in Thursday's Update, I described an interesting set-up in the wave structure. We started with Waves A, B, and C, with Wave A being shorter than Wave C, and Wave D then completing below the Wave A origin. This is a bearish formation since Wave E would need to complete below Wave D. This can be negated by a move above the Wave C high. I mention this because the chart above now displays an identical pattern. This structure indicates a termination point for Wave E below 381. This matches almost exactly the targets I have been given for the previous wave of this type. 

If this wave structure holds, it implies a move below 366 before a rebound to below 378, based on some other projections I have worked up.

As I mentioned earlier, this structure can be negated with a move above the Wave C high, which gives some reasonable levels to watch. The Wave C high for the current wave structure is 393.16, and the Wave C high for the first wave I described on Thursday is 401.48. A move above either of those levels would mean some re-evaluation of the waves is needed.


Sunday, March 12, 2023

Weekend Update 03/12/2023

 The market started off the week on a positive note, with SPY reaching 407.45 Monday morning after closing the previous week at 404.12. That proved to be the high for the week, as the market stumbled through a tumultuous week. SPY worked mostly lower Monday after the higher open, and carried those losses into Tuesday. Wednesday's trading was mostly flat, and Thursday saw a higher open, peeking once again above 400 before dropping to near 390 by the end of the day. Friday's market was choppy, with a lower open, a move back into positive territory, and a sell-off below 385 to close out the week.


On Thursday I detailed a count projecting a move below 379, and possibly a test of the 348.11 low. That remains my count, but with the current uncertainty in the market, I will be monitoring that closely. I will pay close attention to short term waves, and give what I feel are important levels to watch. With that in mind, we'll take a closer look at Friday's action.


As these waves can resolve themselves in several ways, I have denoted the major waves with an "X", and have counted out the sub-waves when applicable. 

SPY traced out 3 waves off the Friday morning low, the second sub-dividing into a 5 wave sequence. From there, there were 3 waves down into the 2:00pm hour. The choppy trading from there looks like two waves, with the second wave a complex corrective wave. The 1 - 2 set-up points to a move higher to begin. One possible count would call for a move higher to the 387-390 level, followed by a move down to 383. 

Short term, the 391 level will be the area to watch. if the 387-390 resistance holds, an initial move to 383 is likely, with a small rebound, and then further lows below 379. A break above 391 would indicate a very complex corrective wave from the morning 393.16 high, and most likely a move above that level, possibly testing the 400 level again.

I'm not going to get too far ahead of myself. At the moment it will be best to take one wave at a time. If we do test the 400 level, the key point will be the 401.48 high. A break above that could mean a change in the overall scenario.

Help fund further research.

Saturday, March 11, 2023

Friday Update 03/10/2023

 In Thursday's Update I made my case for 5 wave sequence having completed on Wednesday, with SPY now being in a sequence that should take it below 379. SPY gapped slightly lower 391.00 to begin the day, then quickly found itself moving significantly lower to 387.48. From that low to midday, SPY worked higher and made it into positive territory for the day, climbing to 393.16. From that point, until the 2:00pm hour, SPY worked lower again, with only one small rally attempt. Shortly before 2:00pm it found itself at 384.32. The following hour saw a rally to 388.42, but SPY dropped near the low of the day again in the final hour of trading, closing the week at 385.92.


My count remains the same from yesterday. I will post a more detailed analysis over the weekend.

Thursday's Update

Please help fund further research.

Thursday, March 9, 2023

Thursday Market Update 03/09/2023

 Today was an interesting day. A lot to update, so I'll get started. I mentioned in yesterday's update that a 5 wave sequence had completed Wednesday at 396.59. As of yesterday, SPY had moved off that low in three waves. Today's session started with some follow through from yesterday. An opening gap higher propelled SPY over the 400 level to a high of 401.48 shortly before 11:00am. For a brief moment it appeared the market may continue higher. After reaching that high, SPY started lower, looking to complete an inverted corrective wave before another move higher. SPY however broke through the lower boundary of that corrective wave, and continued lower the remainder of the day.

Shortly after noon, SPY had fallen to 398.15. After a very short rally attempt, the stock continued lower, dropping to 394.28 just after 2:00pm. After another feeble rally attempt, SPY fell to the low of the day at 390.53. Following a move higher, SPY closed the day at 391.58.

The first item of consequence today was the move to 390.53, which took out the previous 392.33 low. This clarified my dual count from this weekend. This would confirm my original count from the 418.31 high.


To review that count, I have the move to 407.57 as Wave 1. Wave 2 was an inverted corrective wave, shown here as Waves A, B, C, D, and E, with Wave E completing at 407.45. With a 5 wave sequence completing from that 407.45 high yesterday, we now show Wave 3 completed. The implication of this count is SPY should move lower.

I will cover the price action from yesterday's low in detail due to the ramifications of what appears to be unfolding.


Above I show my short term count from yesterday's 396.59 low. The most critical aspect of this count involves the move from 396.15 to today's 401.48 high. If this was a three wave move, it would imply much lower prices. If it was five waves, we could have seen a low today. As you can see, I have counted it as three waves. Due to the importance of this, I will provide the details of my count, and my reasoning. The move from the 396.59 low to Wave A seems to be straight forward. A single wave, supported by the 5D RSI. The move to Wave B again seems to be a single wave, once again supported by the 5D RSI. Wave C sub-divided into 5 smaller waves, as I have indicated. The count from Wave B is 396.95 - 399.16 - 398.63 - 400.62 - 399.97 - 401.48. That gives us (396.95, 399.16), (398.63, 400.62), (399.97, 401.48), with an R^2 value of .99308, completing a 5 wave sequence. Once again this supported by the 5D RSI. As you can see, the 5D RSI went from oversold at the 396.15 low to overbought at the Wave 1 high. Wave B saw the 5D RSI at oversold levels once again, and Wave C came with the 5D RSI at overbought levels.

Once again, this is the critical portion of the count. From Wave C, I have counted a 5 wave sequence down to today's 390.53 low. The first three waves came close to beginning of the wave. Starting from Wave 3, you can see an inverted corrective wave for Wave 4. This sequence went 399.41 - 401.08 - 398.15 - 399.30 - 394.28 - 394.92. Thus we have (399.41. 401.08), (398.15, 399.30), (394.28, 394.92), with an R^2 value of .99782.

We can then count the 5 wave sequence from today's high as 401.48 - 400.58 - 401.27 - 399.41 - 394.92 - 390.53, or (401.48, 400.58), (401.27, 399.41), (394.92, 390.53), with an R^2 value of .99385. This completes 5 waves from yesterday's 396.15 low. Using those 4 completed waves, we can now project the termination point of the fifth wave, Wave E. Because of the configuration of the first four waves, the fifth wave will need to complete below the fourth wave. The fifth wave given this scenario will need to complete below 379. In other words, this wave would need to trade below the 379 level, and then move up to complete below 379. Obviously this is an extremely bearish scenario. When that wave completes, it would likely complete Wave 4 from the 418.31 high. If this wave completes at 379, the lower range for Wave 5 would be 347. If the wave terminates below 379, that range would likely adjust downward.

Earlier I mentioned the importance of the move from yesterday's low to today's high. I will now illustrate that point. For arguments sake we will say that I am wrong in my count, and the move actually occurred in five waves. That would make today's high Wave 4 from the 418.31 high, and put us in Wave 5 from that point. Given the four completed waves the sequence would be 418.31 - 407.57 - 407.45 - 396.59 - 401.48 - X. if we use today's low for "X", we have (418.31, 407.57), (407.45, 396.59), (401.48, 390.53), which gives us an R^2 value of .999999. This means the sequence from 418.31 has likely completed. The lower limit for this scenario is 388, so a move below that would invalidate this scenario.

Given the current count, it appears SPY is headed below 379, and possibly down to new lows. This seems to be the majority opinion, which always sends up a red flag. However the count is pointing that way, so we will let it play out.

Wednesday, March 8, 2023

Market Update 03/08/2023

 As we went into Tuesday's trading session, we were awaiting some resolution to the two counts I discussed over the weekend. A move above 411 would likely mean a 5 wave sequence had completed Thursday at 392.33. A move below 392 would mean a continuation of the move lower from 418.31. 

Tuesday saw a sideways opening, before moving decidedly lower following statements from Chairman Powell. SPY tested the 400 level after those remarks, falling to 400.51 before trying to rally. After moving slightly over the 403 level, SPY once again moved lower, this time breaking through the 400 level momentarily before trying to rally again. This time the rally fizzled at 402, and SPY fell to 397.63 before trying to rally into the close.

This morning saw SPY trying to find some stability, trading mainly between 398-400 until after noon. The 400 level is providing some resistance, and having failed to regain that level, SPY dropped lower to 396.62. A late afternoon rally found SPY once again moving towards the 400 level, but failed once again, closing out the session at 398.92.


Nothing that has happened over the past couple of days has changed our count. I continue to look at the 411 level on the upside, and the 392.33 low for an indication of which direction the market has chosen.


Shorter term, SPY may have put in at least a temporary low at today's 396.62 level. A short term count has SPY completing Wave 1 of a sequence from 407.45 at 406.23. The rebound to 407.38 off that low formed Wave A of an inverted corrective wave. Wave B of that sequence provided the most damage, carving out a lengthy 5 wave sequence that ended this morning at 396.83. The choppiness this morning completed Waves C, D, and E, to complete Wave 2 from 407.45. The late day swoon to the low of the day finished out the sequence at 396.62.

The rally off that low came in three waves, which may be the start of a move higher, or simply a respite from the past two and a half days of selling. 

Help fund further research.

Monday, March 6, 2023

Monday Market Update 03/06/2023

 The market opened stronger today, continuing the late week rally that sprung from last Thursday's opening low. SPY gapped up, opening at 405.08, and remained strong through the early morning. The stock reached 407.45 shortly before 11:30. That proved to be the high of the day, with SPY drifting lower through the afternoon. With half an hour of trading left, SPY closed that opening gap. After hitting a low of 404.03, it once again pushed towards 405.00 into the close.

SPY remained below the critical 411 level I had mentioned over the weekend, so the two counts I reviewed thoroughly in the Weekend Update remain in play. The market is now at an inflection point, and how it reacts at this level will be pivotal.

Technically, SPY came off the overbought levels of the morning to finish the day in oversold territory on the 15 Minute chart. There is also a small positive divergence near the end of the day. 


Since I have been also following TSLA recently, I have decided to include that analysis here also.

Following the sell-off last Thursday that brought TSLA to 186.01, the stock rallied back to 200.48 on Friday. It was unable to hold the 200 level, and saw a bit of a sell-off into today. I continue to count the completion of a 5 wave sequence from 101.81 at 209.41. The following move to 186.01 could possibly be a correction low. 

Today's drop took TSLA into oversold territory on both the 15 Minute and Hourly charts, with a positive divergence on the 15 minute chart, which would be a good place to rally off of. The important levels to watch are the 186.01 low, and the 209.41 high.


Help fund further research.


Stocks to Watch:

Here are a couple of stocks I will be watching on Tuesday.

AMGN:

AMGN gave a short term buy signal today. These signals usually last 1-3 days.


BIDU:

BIDU seems set up for a short term buy signal. While the signal has not been given yet, a higher open would likely trigger one.


PDD:

PDD is in the same position as BIDU. No signal yet, but a move higher from here would likely trigger one.


Weekend Market Update 03/05/2023

 For some time I have targeted the 396 level, to be followed by a move the 406-411. SPY spent most of the past two weeks bouncing around the 402-392 level. On Friday we did see SPY finally break above that 402 level. When last I posted, my current count from the 418.31 high was this:


SPY had moved slightly below the level at which I was expecting to see a move higher. The action from the 21st to the 24th was choppy, and difficult to follow at times. Now that it has resolved itself I can revisit this count, and see where we are. After reviewing the count further, I was able to clarify some of the action, and show a slightly revised count here:


The major revision involved seeing Wave E(Purple) as a more extended wave that ended on the 23rd at 402.20. Waves 3,4 and 5(Purple) then completed on the next move lower to 396.25, completing Wave D(Green). From there we can walk through the rest of the count. Wave 1 (Green) completed at 408.51. Wave 2(Green) then completed as an inverted corrective wave, which broke down into A-B-C-D-E, giving us 408.51 - 413.65 - 409.47 - 414.00 - 396.25 - 401.62. Analyzing the sequence (418.51, 413.65), (409.47, 414.00), (396.25, 401.62) gives an R^2 value of .99837.

We can now see that the Green 5 wave sequence completes as 415.05 - 408.51 - 401.62 - 393.64 - 401.29 - 392.33. (415.05, 408.51), (401.62, 393.64), (401.29, 392.33), gives an R^2 value of .99731.

The completion of that sequence is Wave D(Red). Given the four competed waves of this sequence, A-B-C-D(Red), we can now calculate the range in which Wave E(Red should complete. SPY has already entered into that range, with the maximum of that range being 411.19. That level may be an important one, as I will explain.

The above count calls for a high between the the current price levels and 411.19, to be followed by three waves down to complete the 5 wave sequence from the 418.31 high. There is an intriguing alternate count which I will discuss now.

In the current count Wave B(Red) completed on the 10th at 405.01. From that point there are 5 counted waves to the 414.00 high on the 15th. I am currently counting these as Wave C(Red), Wave 1(Green), and Waves A-B-C(Green). This still seems to be the best count, but there is an important alternate count to consider. I currently show the first wave from Wave B(Red) completing at 415.05. A case could be made for that wave having completed slightly earlier, at 412.97, followed by a complex corrective wave to 408.51. Taking that as the high gives the sequence from 405.01 as 405.01 - 412.97 - 408.51 - 413.70 - 409.47 - 414.00. (405.01, 412.97), (408.51, 413.70), (409.47, 414.00), with an R^2 value of .99343. That would put the Wave C(Red) endpoint at 414.00. 


This shows the alternate count using 414.00 as Wave C(Red). I filled in the remainder of the alternate count with "?". Continuing with that count we see that Wave 2(Red) completes as 407.57 - 416.49 - 405.01 - 414.00 - 396.25 - 401.62. (407.57, 416.49), (405.01, 414.00), (396.25, 401.62) gives us an R^2 value of .99636. The entire 5 wave sequence from 418.31 can then be seen as 418.31 - 407.57 - 401.62 - 393.64 - 401.29 - 392.33. (418.31, 407.57), (401.62, 393.64), (401.29, 392.33) gives an R^2 value of .99632.

It seems that SPY is at an inflection point here, which makes the current price levels extremely important. A move above the 411.19 upper limit I discussed earlier would likely make the alternate count I have discussed the correct count. 

There is some further evidence of a bottom having been put in at 392.33. In my TSLA update yesterday I discussed one method for determining a likely limit for a corrective wave using the previous low, the correction low, and the last two high of the previous wave. The 392.33 low would satisfy that method. SPY has also given a technical buy signal on the daily chart. We will see if those hold over the coming days.

TSLA Weekend Update

Help fund further research.

Sunday, March 5, 2023

TSLA Weekend Update 03/04/2023

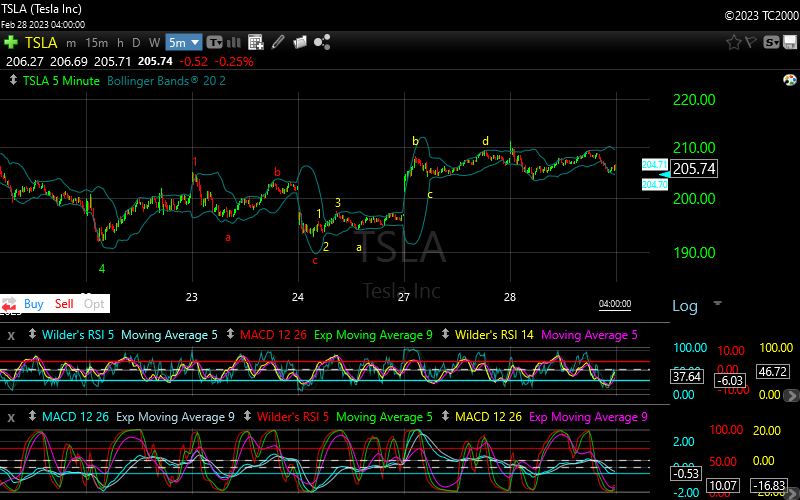
 In Tuesday's Update, my analysis was that TSLA had completed 5 waves of a 5 wave sequence from 101.81, and set a target between 212-234. I gave 191.78 as a point at which that analysis would be invalidated. Wednesday saw TSLA move lower from the opening, falling to a low of 198.52. During the afternoon TSLA moved mostly sideways, with a slight upward bias, rising to 203.42, before closing at 202.75. Technically TSLA hit oversold at the open on the 15 minute chart, and the sideways move into the close worked off that oversold condition, and worked into overbought territory, setting up a lower low, lower high situation going into Thursday.

Given that set-up, TSLA gapped down on Thursday, dropping to 186.01, and moving below the critical 191.78 level necessitating a revision to my analysis. Once again TSLA moved mostly sideways the remainder of the day, rallying slightly off the low, and then falling again into the afternoon. This action created a short term buy signal at 3:45 on my technical charts, with TSLA at 191.07. 

TSLA gapped up on Friday, opening at 194.61, and continuing to rise through most of the day. My short term technical signals gave a cover at 199.13. TSLA topped at 200.48, before giving back a little ground into the close.

With TSLA moving below the 191.78 level, we will need to review our analysis. I will begin where I left off on Tuesday. 


Here is my count from Tuesday. As you can see, I had TSLA in Wave 3 of Wave 5 from 101.81, with a target of 212-234. Obviously this was wrong. One thing I had noticed on Tuesday, but had discounted, was the initial move off the Wave 4(Green) low on the 22nd. If that initial move were Waves 1,2, and 3, instead of Wave 1, the wave from Wave 2, the move following the low marked Wave 2(Red) on the 28th to the upper Bollinger Band would complete a 5 wave sequence from that Wave 4 low. This would look like 191.78 - 201.99 - 196.82 - 205.14 - 203.75 - 209.41. Taking those as points, and applying a linear regression, we get (191.78, 201.99), (196.82, 205.14), (203.75, 209.41), with an R^2 value of .99998. The move from Wave 4 would now look like this:


As you can now see, TSLA completed a 5 wave sequence from the 191.78 Wave 4 low. I had originally discounted this for two reasons. The first being that it would require a wave 5 failure, as it would not complete at the high, which is rare, and the second being that it did not meet the requirements for Wave 5. So now we must re-evaluate the count from the 101.81 low.


This had been my count going into Wednesday. For the sake of clarity I removed the smaller waves from Wave 4, and marked the end of the 5 wave sequence from that point with "X". The initial move is notated by Wave 1. Following the green A-B-C-D-E, will lead you through what I had counted a an inverted corrective Wave 2. This took the form (123.52. 115.60), (136.68, 124.31), (214.00, 187.61), with an R^2 value of .9943. Normally the first instance of sequence exceeding the R^2>.99 threshold denotes the end of a sequence. However, that is not always the case. If one looks at the sequence B-C-D-E-3-4, one would notice that this also forms a sequence with an R^2 value over .99. Namely (136.68, 124.31), (214.00, 187.61), (217.65, 191.78), with an R^2 value of .99978. Changing A and C to 2 and 3 respectively, and following that with an inverted corrective Wave 4, results in this chart:


Now we can evaluate the sequence 1-2-3-4-X from 101.81. With Wave X terminating at 209.41, we have (101.81, 123.52), (115.60, 136.68), (191.78, 209.41) with an R^2 value of 1. Thus we have a 5 wave sequence from 101.81 completing at 209.41.


The decline from the 209.41 high formed a 5 wave sequence down to the subsequent 186.01 low as is seen here:


One method of creating a target range for a corrective wave is to look at a relationship between the origin of the previous wave, the subsequent corrective low, and two highs from the previous wave, normally the last two highs, as depicted here:


Using this method gives a range between 178-188 for the correction from the 209.41 high. Thursday's 186.01 low falls right into that range. While still too early to call that a low, it is quite possible.

Technically, TSLA is close to giving a buy signal on the 15 minute chart, but has not as of yet. On the 60 minute chart the stock has reached overbought, and on the Daily chart it is oversold, and close to giving a buy signal. The action over the next few days should give us some insight into short and longer term direction. 


Tuesday, February 28, 2023

TSLA Tuesday Update 02/28/2023

 If you read Monday's Update, you had a pretty good roadmap for today's session. In that update I said I was expecting a move higher at the open, followed by a 6-8 point pullback. TSLA did open higher, gapping up and hitting a high of 211.23. It is notable that it stopped just shy of the 212 lower bound that would end the sequence from the 101.81 low. It is nice when a forecast comes to fruition, but obviously they will not all be that good. But the accuracy does speak to the forecasting power of my model. Some set-ups lend themselves to highly accurate forecasts, while others are more difficult. I thought I would walk through what I saw yesterday in the set-up, and how I was able to arrive at those forecasts.


Going into today's session, this was the set-up. On the lower left side of the chart you will see a 4 on the 22nd. I will start there. My count has Wave 1 completing on the open of the 23rd. The next labels you will see are for Waves A, B, and C. These are the first 3 waves of a 5 wave sequence. From Wave C, there are labels for the first three waves of a lower level sequence, Waves 1, 2, and 3. After that another sequence with Waves A, B, C, and D labeled. From Wave D, you will notice a slight pullback into the close. My model is based on a simple premise: Namely that when waves are taken as points, with coordinates (Startpoint, Endpoint), and a linear regression is applied to those waves, a wave completes when the first, third, and fifth waves of a sequence have an R^2 value above .99.

I will start with the final A-B-C-D sequence on the chart. The previous Wave 3 is our start point, so we have 197.67-194.00-208.22-204.22-209.42. Taken as points, that gives, (197.67, 194.00), (208.22, 204.22), (209.42, X), where X would be the Wave E completion point. The pullback at the end of yesterday's session had a low point of 206.35. Using that as X, the resulting linear regression gives an R^2 value of .9952, above the .99 threshold. This allowed me to consider that as the endpoint of the sequence.

The A-B-C-D-E sequence was then the end of Wave 4 of the 1-2-3 sequence started on the 24th. So we have (192.80, 195.67), (193.58, 197.67), (206.35, X). The minimum value for X that gives an R^2 value above .99 for that regression is 208.02. This gave a me a minimum value for today's opening move up. The high of that move, 211.23 gives an R^2 value of .9955.

That opening move to 211.23 thus completed the 5 wave sequence from Wave C on the 24th, or Wave D. Given the four completed waves, the sequence is (205.14, 196.33), (203.28, 192.80), (211.23. X). Being able to infer today's opening move allowed be to extrapolate that into the 6-8 point pullback, since it would be completing the inverted corrective wave starting with Wave 1 on the 23rd. The pullback to 203.75 was just under 8 points, and gave the sequence an R^2 value of .99086.

The final count after that is shown here:


Looking at today's action, we had the opening rise to 211.23, followed by a pullback to 203.75. That sequence looked like, (211.23,206.43), (208.43, 204.71), (206.19, 203.75), with an R^2 value of .99038. From there the market moved higher again, tracing out a five wave sequence as (203.75, 206.33), (204.86, 207.88), (206.31, 209.41), with an R^2 value of .99357. After that TSLA moved lower, dipping to 204.91, before trying to rally into the close.


In my current count from the 101.81 low, TSLA has now completed four waves of a five wave sequence, with Wave 4 completing at 191.78. Today's low would be the completion of Wave 2 from that Wave 4 low. With four waves completed, we can project Wave 5 to complete between 212, and 234. That remains my current target. Some of my work shows a convergence around 229, but any move between 212, and 234 would be sufficient to complete the sequence. The 191.78 Wave 4 low would be a critical point. A move below that would require a revision to the current count.

Help fund to further research.