Up until this point I have kept my current count from the 1266.74 low intact, even though I have had some reservations about it, which I have expressed from time to time. The main problem with this count has been the increasingly higher projections it has been giving with each completed wave. I have kept this count because I better one has not presented itself until now. At this time I feel a better option, or at least an equally good one, has appeared.
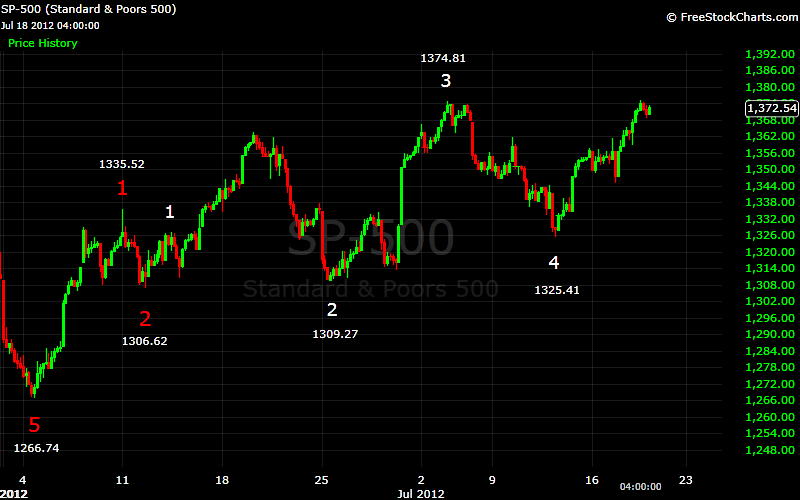
I’ll start by reviewing my current count from 1267. This begins with the completion of a 5 wave sequence from that low at 1335.52. This is wave 1 in red on the accompanying chart. A corrective sequence to 1306.62 has been labeled wave 2 in red. A five wave sequence to 1327.28 completed wave 1 of a smaller degree, which is labeled in white. Wave 2 of this sequence I had labeled as a semi-inverted corrective wave, which terminated at 1309.27. Five separate 5 wave sequences then completed white wave 3, and another 5 waves down completed wave 4. That would have the market currently in white wave 5, which would complete wave 3 in red, of a 5 wave sequence from 1267.
The main issue I have had with this entire sequence from 1267 is the move from 1306.62, labeled wave 2 in red, and 1309.27, which is labeled wave 2 in white. From 1306, I have white wave 1, followed by wave 1 if the semi-inverted corrective wave in green, followed by waves 1 through 5 in yellow, which completed wave 2 in green of the semi-inverted corrective wave. This is followed by waves 3, 4, and 5 of the semi-inverted corrective wave in green, which terminates at wave 2 in white, or 1309.27.

While this count satisfies my model, it seems a bit convoluted. By simply using waves 1 through 5 in yellow from 1306.62, my model is also satisfied. I have refrained from using this count because the move from 1306.62 to yellow wave 1 doesn’t break down easily into a 5 wave sequence. However, this appears to be the simpler, and at the moment, better solution.

I’ve labeled this possibility as A-B-C-D-E on the chart for clarity. The move down from 1363.46 to 1309.27 is also interesting. A clear 5 wave sequence formed to 1324.41, and after a short rebound the market dropped to 1309.27. This entire wave breaks down into a 5 wave sequence the best, but for this discussion, I’ll also assume that it breaks down into two separate 5 wave sequences.
On the next chart I have replaced all the numbers with X’s to mark the 5 wave sequences I have identified.

And on this chart, I show the possible new count. This count would put the market in wave 5 from 1267, which projects to 1393.

No comments:
Post a Comment