Thursday, May 22, 2014

Thursday's Market 05/22/14

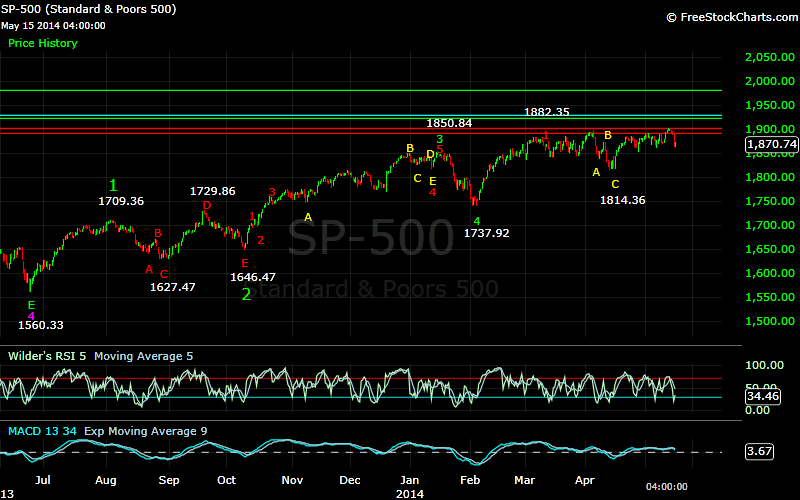
After some hesitation, the SPX broke through the 1892-1894 I have been mentioning, albeit without much conviction. As I talked about yesterday, this likely means a longer duration move to complete the wave from 1074.77. Due to that breakthrough, it appears there are still several waves to go, although it may remain choppy throughout. My minimum target remains at 1957.


The day started slightly higher, but the SPX quickly reversed and dropped to 1885.39. The index rose steadily from that point, hitting 1992.20 before pulling back to 1888.29. The SPX then turned once again, climbing steadily to 1895.96. The index then traded in a narrow range through the afternoon, hitting the high of the day at 1896.33 before slipping into the close.

It looks like the SPX completed a wave 1 from yesterday’s 1882.12 low at the open hitting 1888.80. The dip that followed was wave 2, and the rise to 1992.20 wave 3. The drop to 1888.29 was the wave 4, and the rally to 1895.96 completed wave 5. The SPX then moved lower in three waves. 
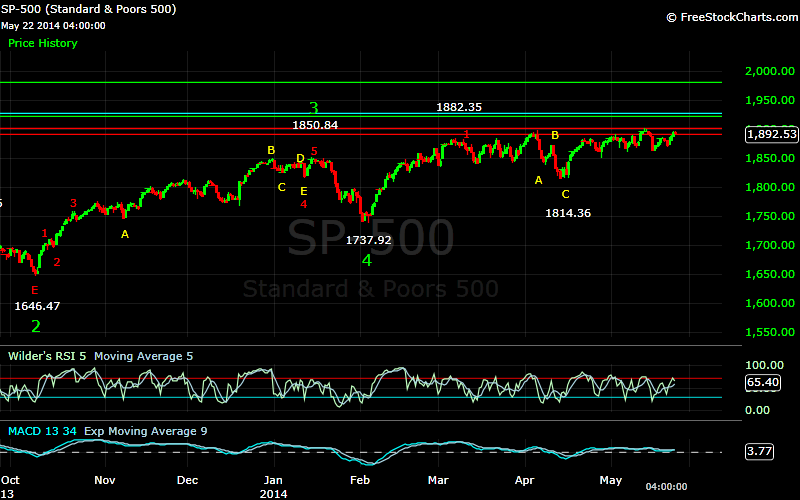
Looking at the SPX from Monday’s 1886.00 high, I had counted the move to 1882.12 as an inverted corrective wave. It now appears that this was only wave A of the corrective wave, with wave B completing at 1895.96. The three waves lower then completed waves C, D, and E, and Wave 2 from 1886.00. The slight move higher from that point unfolded in three waves, and looks to have completed a 5 wave sequence from 1862.36 as 1886.00-1893.27-1895.97-1895.11-1896.33.


This market may continue in a somewhat choppy fashion until it completes, but with several waves left to complete, the potential for a sustained move higher have increased. A lot will depend on the next several waves, and how they unfold. With a sequence completing today, a pullback from these levels would be expected. A move lower to 1875 would complete an inverted corrective wave from 1884.89, and Wave 2 from 1814.36. The waves that follow that should tell a lot about how high this market may go.

The SPX is now in that 1891-1902 support/resistance level I have previously mentioned. Next support would be 1875, with resistance at 1923-1928.


Wednesday, May 21, 2014

Wednesday's Market 05/21/14

The 1893-1894 resistance area looms large after today’s trading. A misinterpretation of the last pullback mentioned in yesterday’s analysis led to an incorrect conclusion as to what would unfold today. Instead of resuming the move lower, the SPX gapped up and barely looked back on its way to 1888.80.


It is easy to get caught up in the daily gyrations of the market, but important to keep the larger view in mind. Looking at the Weekly chart above, the SPX completed Wave 1 at 1219.80, Wave 2 at 1010.91, and Wave 3 at 1370.58, from the 666.79 low. From that point the index appears to be in an inverted corrective Wave 4, with Wave A completing at 1074.77. Wave B of 4 has been unfolding ever since, meaning I do not see the end of this bull market as imminent.


This Wave B is unfolding in a similar fashion, with Waves 1, 2, and 3 completing as 1292.66-1158.66-1422.38. Wave 4 was also an inverted corrective wave in this case, and completed at 1560.33 as 1266.74-1474.51-1343.35-1687.18-1560.33. The minimum target for Wave 5 was 1776, which of course the SPX has already surpassed. I am now looking for the lesser degree waves to complete a 5 wave sequence to mark the end of Wave 5, and Wave B of 4 from 666.79.


To re-iterate, I am looking for the SPX to now complete a 5 wave sequence to complete the entire sequence from 1074.77. I am counting this wave thus far as Wave 1 at 1709.36, an inverted corrective Wave 2 at 1646.47, Wave 3 at 1850.84, and Wave 4 at 1737.92. Wave 5 in this case gives a minimum target of 1957. Wave 5 to this point looks to have completed Wave 1 at 1882.35, and Waves A, B, and C of an inverted corrective Wave 2, with Wave C completing at 1814.36.


The wave from 1814.36 can be counted in two main ways at the moment. First, it can be series of nested waves, 1884.89-1850.61-1891.33-1862.36. It can also be looked at as Wave 1 at 1884.89, Wave 2 at 1850.61, Wave 3 at 1891.33, and an inverted corrective Wave 4 at 1862.36. This is the count that gives a Wave 5 target at the 1893-1894 level I mentioned at the beginning.


I won’t go through all the possibilities at this point, but I thought it important to give an overall view of my count. So that brings us to the wave that started at 1862.36. A five wave sequence ended at 1886.00, and appears to be a wave 1. I thought this was possibly the end of Wave D of an inverted corrective wave from 1884.89. A drop to 1852 would have completed this wave. Given yesterday’s action this seemed a likely scenario, as the SPX moved down in what appeared to be 3 waves. The bounce into yesterday’s close appeared to be a wave 4, with a wave 5 target of 1852. That seemed to fit pretty nicely, but the market usually has a mind of its own. The gap up open put this count in jeopardy, and by the middle of the day it was obvious that this was the incorrect interpretation.

The very small pullback into the close yesterday was part of an inverted corrective wave, but in the opposite direction. The bounce yesterday afternoon to 1875.89 now looks like a wave 1. That pullback, followed by the strong open this morning to 1886.06, and finally the pullback to 1879.87 look to complete an inverted corrective wave 2. The SPX then completed 3 waves up from that point to 1887.32 to complete waves 3, 4, and 5. This looks to be Wave D of what turned out to be an inverted corrective Wave 2 from 1886.00. The next pullback to 1882.12 completed this wave.

So now the SPX sits at a pretty important point. The resistance level I have been mentioning is very narrow. At this point the current wave from 1862.36 would have to complete between 1892.5 and 1894.5 to complete a larger wave from 1814.36. This would then imply a pullback back into the 1850 level. Since this resistance area is so narrow, it is easy to gap over, or push through. The very short term count for the last move higher today looks like a wave 1 followed by an inverted corrective wave, so it looks like we will start off higher tomorrow.

If the SPX gets above 1894.5, it is more likely that the move from 1862.36 is part of a larger inverted corrective wave 2 from 1814.36, and possibly a more bullish scenario. This would likely signal a “breakout “ from the current trading range, while the first scenario would likely mean continued choppiness into 1957. 

Tuesday's Market 05/20/2014

After reaching 1886.00 yesterday, the SPX started the day off to the downside. After just over 30 minutes of trading the index had fallen to 1877.47. From there the SPX started to rebound, bouncing back to 1882.91. After that it was downhill all the way, as the index dropped steadily throughout the afternoon, reaching a low of 1868.14 before moving higher. This took the SPX to 1875.89, but started giving back some of those gains into the close.


Looking at the wave structure from yesterday’s 1886.00 high, I count the drop to 1877.47 as a Wave A down. The move back up to 1882.91 was 5 waves, and can be counted as Wave B. The decline throughout the afternoon also looks like 5 waves which completed Wave C at 1869.05. I can also count 5 waves up to 1875.89 for the fourth wave, or Wave D. The move down from that high does not look like a completed sequence, but rather 1 wave down followed by an inverted corrective wave completing just before the close. This implies a further move to the downside.

The 4 completed waves, 1877.47-1882.91-1869.05-1875.89, give a fifth wave target near 1852, the same level I mentioned yesterday as a possible end point for this wave. If the SPX completes this wave at this level it would complete an inverted corrective wave from the April 22nd 1884.89 high.


If my short term count is wrong, and the SPX moves higher from here resistance is still at 1893-1894, and then 1924-1925.


Tuesday, May 20, 2014

Monday's Market 05/19/2014

The SPX started the day by moving lower; a gap down, and then a continuation down to 1872.42. This was a larger pullback than I had anticipated, as I had thought that Wave 4 from 1862.35 had either completed, or was close to completing near Friday’s close. From there the index rose in a somewhat choppy fashion to 1881.66. I had given 1887 as the target for the completion of Wave 5, but the pullback this morning altered that target. It now looks like 1881.66 completed Wave 5. The SPX pulled back slightly from that point before climbing to 1884.89. Another choppy pattern developed through the afternoon, which ended at 1882.58. A final move higher pushed the index to 1886 just before the close. It appears that the SPX completed a larger degree wave from the 1862.35 low to today’s 1886 high as 1881.66-1879.60-1884.89-1882.58-1886.


The SPX still seems to be indecisive, leaving open several possibilities. As I mentioned on Friday, there is resistance at 1893-1894. A move to that level, followed by a pullback, could result in a drop back to the 1850 level. As I also noted on Friday, sometimes a sequence will terminate slightly below a resistance level so the next move can gap over that level. A move above 1894 most probably means a run up to 1924-1925.


With the completion of a 5 wave sequence today there is one other possibility. The choppiness of late is either result of nested waves, which is my current count, which should result in a more extended wave, or the result of complex corrective waves forming. With this in mind a pullback from these levels to 1852 would complete one of those complex corrective waves, and clear up some of the uncertainty in the wave counts. As far as that goes, a move to 1893-1894 followed by a pullback to 1863 would clear things up even more. I continue to this as the 5th wave from 1560.33, which should conclude above 1957 and complete the entire wave from 1074.77.

For the moment resistance is at 1893-1894, and then 1924-1925. Support is at 1852.


Friday, May 16, 2014

Friday's Market 05/16/2014

The SPX worked slightly lower in the first few minutes of trading, dropping to 1866.99 before bouncing to 1871.77. That bounce was followed by another move lower to 1864.82. A slightly better rally followed, with the index moving up to 1873.04 before dipping back to 1868.14. An even better rally followed this dip, with the SPX hitting a high of 1878.28 before falling back into the close.


After completing a 5 wave sequence at 1872.49 after yesterday’s 1862.36 low, the SPX started the day off by completing three waves down from 1872.49. This can be counted as Waves A, B, and C of an inverted corrective wave. The rally off the 1864.82 occurred in 5 waves, and completed Wave D. Another 5 wave sequence lower to 1868.14 then completed Wave E, and Wave 2 from yesterday’s low. The rally from that low looks like Wave 1 at 1871.01, an inverted corrective Wave 2 at 1875.54, and Waves 3, 4, and 5 completing in quick succession at 1877.39-1877.23-1878.28.

This completes 3 waves from yesterday’s 1862.36 low. Wave 4 may also have completed with the slight pullback before the close. If so, this would give a Wave 5 target of around 1887. As I pointed out yesterday, there is a danger zone between 1893 and 1895. Completing a sequence just below that level could set up a gap above that resistance level, but that is getting too far ahead.

Yesterday’s 1862.36 low continues to be a critical level. A break below that level would likely lead to much lower prices.


Thursday, May 15, 2014

Thursday's Market 05/15/2014

The SPX opened lower today, continuing the slide from yesterday afternoon.  The index worked its way below 1874 after the first half hour, and then chopped steadily lower until it bottomed at 1862.36 by mid-day. After shedding nearly 40 points in less than three days, the SPX tried to recover through the afternoon, gaining ten points from the low near the close.


From Tuesday’s all time high of 1902.17, the decline had been straight forward. The SPX first completed a 5 wave sequence yesterday morning at 1891.46. The index then completed an inverted corrective wave just before the close yesterday at 1888.87. Today the index followed that inverted corrective second wave with a strong move to the downside that ended at 1862.36. With three waves completed from the high, the expectation would be for a slight move higher, followed by another move to the downside to complete the fifth wave. It does appear that the SPX completed a 5 wave sequence from the low to 1872.49. A 5th wave down from this point would give a target of below 1837.

This, however, may not play out as outlined above. Looking at the SPX from the 1891.33 high, I counted a 5 wave sequence that ended at 1867.02. The ensuing run-up to 1902.17 also completed in 5 waves. These two waves combined with the 3 waves down from 1802.17 gives us the sequence 1891.33-1867.02-1902.17-1891.46-1888.87-1862.36, which works as a semi-inverted corrective wave from 1891.33. The three points, (1891.33, 1867.02), (1902.17, 1891.46), and (1888.87, 1862.36) have a correlation of .9994. This would indicate that the SPX should now move higher, with a first target around 1909. This fits with my longer term count that the SPX is in Wave 5 from the 1560.33 low, with a target above 1957, which will in turn complete a 5 wave sequence from the 1074.77 low.


This market has been extremely choppy and complex from that 1560.33 low, with a multitude of possible ways this thing could end. This choppiness could continue for awhile, creating maximum confusion before an eventual correction. For some time every move lower has been accompanied by the doom and gloom faction calling for a market crash, while every move higher has heard calls of SPX 2200 and higher. Both are possibilities, but for me the fact that every market move elicits such diverse reaction lends credence to the continued choppiness scenario. For the moment it is best to look at this market wave by wave, while continuing to look at 1957 as the minimum upside target. Until some confirmation to the contrary changes that, I will use that as my primary scenario, and try to give points where alternate scenarios may complete.

Given today’s set-up, I am looking for a move higher, to near 1909. If the SPX drops below today’s low of 1862.36, the SPX could be headed below 1837. If the index does move higher, there is a danger area between 1893 and 1895 that could trigger another pullback similar to the one we have seen the last few days.


Thursday, May 8, 2014

Thursday's Market 05/08/2014

The SPX opened slightly lower this morning, dipping to 1874.55 in the first few minutes. Following that dip the index continued the rally off yesterday’s low. The SPX ran up to 1887, fell back to 1883, and then moved higher to 1889. This has been a pretty impressive rally, with the SPX moving up 29 points from yesterdays low. After hitting 1889 the index started to pull back. The SPX moved steadily lower throughout the afternoon, dropping to 1870.05 before bouncing into the close.


This morning’s run up was unexpected form my point of view, but may actually turn out to be more bearish than if the decline had continued this morning. After reviewing my charts, this appears to be a semi-inverted corrective wave from the 1880.58 low. This means today’s high was the completion of the second wave from the 1891.33 high. The decline from today’s high looks to be a 5 wave sequence, and possibly the third wave from 1891. If the bounce into the close was the fourth wave, the fifth wave would now project to the 1775 support level.

Resistance is still between 1892 and 1902, and the 1923.


Wednesday, May 7, 2014

Wednesday's Market 05/07/2014

The SPX responded to yesterday’s weakness with a gap up opening, which took the index back to 1876.01 within the first few minutes of trading. A sharp reversal followed, and the SPX soon found itself in negative territory for the day. This downturn took the index to 1859.79, which turned out to be the low of the day. The SPX started to move higher once again, hitting 1869.12 before taking a pause. After pulling back to 1865.29 the index then continued higher to 1876.46. A choppy pullback followed, this time taking the SPX to 1868.43 where it reversed again, and then moved higher into the close with only one four point pullback along the way.


Continuing the count from the recent 1891.33 high, I have Wave 2 completing on Monday at 1885.51. Wave 1 of 3 then completed yesterday at 1876.03, and what looks like Wave 2 of 3 at 1881.27. Wave 3 of 3 then completed at yesterday’s low of 1867.77. That would make today’s opening move higher to 1876.01 Wave 4 of 3, and the ensuing drop Wave 5 of 3, which I have completing at 1861.10. This now completes three waves from 1891.33.


From 1861.10, a 5 wave sequence can be counted as 1869.12-1868.43-1875.37-1871.75-1878.83. The second wave was an inverted corrective wave which completed as 1865.29-1875.52-1869.61-1873.99-1868.43. This would now seem to complete four waves from 1891.33, with only the fifth wave down to come.

With four waves now completed, the fifth wave should complete between 1844 and 1830, with an optimal target of 1838. If the SPX does move higher, resistance is between 1891 and 1902. After 1902 the next resistance would be 1923.


Tuesday's Market 05/06/2014

Although yesterday’s market action was similar to the previous Monday’s, with both featuring an early sell-off followed by a strong recovery, the next day’s reaction was the exact opposite. Whereas last week the strong Monday afternoon recovery carried over into Tuesday, and set the stage for a week- long rally, yesterday afternoon’s rally was met by a sharp opening sell-off.


The SPX dropped to 1875.91 within the first fifteen minutes of trading, and after a short period of choppiness, rallied back to 1881.27. That rally was short-lived, as the index dropped to 1874.88, bounced back to 1878.78, and then fell throughout the day until it reached 1868.19. A small bounce took the SPX to 1872.37, but again was followed by a drop into the close to 1867.77.

Today’s action would seem to confirm yesterday’s count of an inverted corrective wave completing at 1885.51. Rather than continuing on to complete the last three waves from the 1891.33 high, the SPX appears to be setting itself up for a further decline. If my count for this decline is correct, the index has now formed a series nested waves from that high. The highest degree first wave completed at 1880.58, which was followed by the inverted corrective wave to 1885.51. The next degree first wave completed today at 1876.03 and the third degree first wave at 1874.88. This set-up would indicate a sharp decline to follow. I am still looking for support at 1849, and then 1775.

If my short term count is wrong, there may be support from just below current levels down to 1864. A small pullback into that range, followed by a bounce above 1872.37 could lead to a strong rally, but for now it appears that this decline will continue.


Tuesday, May 6, 2014

Monday's Market 05/05/2014

Today was in some respects similar to last Monday. Last Monday the SPX opened lower at the open, and then found a bottom from which it staged a strong rally. Today was similar, although the selling did not last quite as long before finding a bottom. After a gap down opening, the SPX fell sharply in the opening minutes, dropping to 1866.77. From there the index rallied, reaching 1881.86, and closing the opening gap in slightly more than an hour. A period of choppy trading ensued through the middle of the day, with the SPX putting in a low at 1879.46. The rally continued from there, as the index hit 1885.51, before fading slightly into the close.


Counting from Friday’s 1891.33 top, the SPX completed a 5 wave sequence at 1880.58. Another sequence higher completed at 1885.98, and was followed by a sequence lower which ended with today’s weak opening. The rally so far has formed three waves, 1881.86-1879.46-1885.51. The first 1880.58 low can be counted as a wave 1, and the move from that point, 1885.98-1866.77-1881.86-1879.46-1885.51 counts as an inverted corrective wave, or a wave 2. This implies another move lower for the SPX, at least in the very near term.

For this short term count to remain valid the SPX would need to remain below 1886. Support would be at 1849, and then 1775. If the SPX does continue higher, there will be a small band of resistance between 1893 and 1896. A move above this resistance would likely mean one of the more bullish scenarios I outlined yesterday is in play. As of now all three scenarios remain valid.


Sunday, May 4, 2014

Weekend Outlook 05/04/2014

The SPX entered Monday trying to halt the sell-off from the previous week.  At the outset it looked as if it was going to do just that, staging an early morning rally to 1877. The rally ended there, with the SPX moving to a new short term low at 1850.61. That also marked the low for the week, as the index rallied sharply from that point, making it all the way back to 1873 near Monday’s close. The rally continued into Tuesday, with the SPX moving up to 1880.60. After a small pullback to 1872.69, the index drifted mostly higher through the week, topping out at 1891.33 on Friday.


From Monday’s 1850.61 low, it appears the SPX completed a simple 5 wave sequence as 1880.60-1872.69-1888.59-1879.96-1891.33. The completion of this sequence at 1891.33 opens the possibility for several longer term counts, which I will try to expand upon one by one.


I will start with the count I have been carrying for some time. This count has the SPX completing the first three waves of a 5 wave sequence from the October 2011 1074.77 low as 1292.66-1158.66-1422.38. The fourth wave of this sequence was an inverted corrective wave that completed as 1266.74-1474.51-1343.35-1687.18-1560.33. Since 1560.33 I have been waiting for a 5 wave sequence to complete, which would complete the entire sequence from 1074.77

From 1560.33, the SPX completed the first wave at 1709.36. Wave 2 was an inverted corrective wave that played out as 1639.43-1669.51-1627.47-1729.86-1646.47. A sequence then completed at 1850.84, and was followed by a sequence down to 1737.92. These may have been waves 3, and 4 from 1560.33, and would project a minimum target for Wave 5 of 1957, with an optimal target of 2001. In this scenario Wave 1 of 5 completed at 1882.35, and was followed by three waves down, which would likely be Waves A, B, and C of an inverted corrective wave. If the SPX holds above the recent 1850.61 low, this would be the most likely scenario, but cannot be ruled out unless the index falls below 1814.36. This count has held up pretty reliably for some time, and given the nature of this market I would be reluctant to discard it unless there is more confirmation to the contrary.

The second count is the same as the above until the SPX reaches 1850.84. The move from 1850.84 to 1814.36, 1737.92-1882.35-1837.49-1872.53-1814.36, can be counted as an inverted corrective wave. This would make 1850.84 only Wave 1 of 3 of 5 from 1560.33, and the move to 1814.36 Wave 2 of 3. It is then possible that Wave 3 from 1560.33 completed this week as 1850.84-1814.36-1884.89-1850.61-1891.33. This would mean the index would need to complete Wave 4 to the downside and Wave 5 to the upside before completing the sequence from 1560.33, and from 1074.77. The target for Wave 4 would be first 1849, and then 1775. Wave 5 would then be longer than Wave 3, which was about 245 points.  Whereas the first scenario I outlined would indicate higher prices from current levels, the second would indicate a further pullback before prices advance again.

The third scenario requires a slightly different count from the 1074.77. In this count 1292.66 as Wave 1, but then has 1158.66 as Wave A of an inverted corrective wave. 1422.38 would then be Wave 1 of B, which was followed by the same inverted corrective wave as discussed previously as 1266.74-1474.51-1343.35-1687.18-1560.33 to complete Wave 2 of B. Waves 3, 4, and 5 then completed as 1709.67-1627.47-1729.86. This would have completed Wave B from 1292.66, with Waves C, D, and E completing as 1646.47-1850.84-1814.36, and thus completing Wave 2 from 1074.77. Waves 3, 4, and 5 would then have completed as 1884.89-1850.61-1891.33. This would mean that the sequence from 1074.77 completed on Friday at 1891.33. Again, I would be looking for some confirmation before becoming convinced of this scenario.

Given these three scenarios, it is likely that the SPX will continue higher, possibly to at least 1957, although this pullback may continue a little longer. 1850 seems like an important level to watch.

Thursday, May 1, 2014

Thursday's Market 05/01/2014

For some time now I have been tracking a 5 wave sequence from the June 24th low of 1560.33 on the SPX. I have been looking for the end of this sequence to complete a larger 5 wave sequence from the October 4th 2011 low of 1074.77. The sequence from 1560.33 began with Wave 1 to 1709.36, and was followed by an inverted corrective Wave 2 which completed at 1646.47. After that the SPX completed a 5 wave sequence higher to 1850.84, which I had originally counted as Wave 3 from 1560.33. This was followed by a sequence lower to 1737.92. Another sequence completed to the upside at 1882.35. From this point the SPX became quite choppy, and by my count 3 waves into the 1814.36 low as 1837.49-1872.53-1814.36. These 5 waves from the 1850.84 high, 1737.92-1882.35-1837.49-1872.53-1814.36, count as an inverted corrective wave. Since Wave 2 from 1560.33 was an inverted corrective wave and normally only one corrective wave in a sequence is complex as Wave 2 was, it is best to count 1850.84 as Wave 1 of 3 from 1560.33, and the subsequent inverted corrective wave as Wave 2 of 3.


This count suggests that the SPX should form 3 waves higher from 1814.36 to complete Wave 3 from 1560.33. This would then be followed by a corrective Wave 4, and then one final move higher to complete the sequence from 1560.33, and also a sequence from 1074.77. Looking at the relationship between Wave 1, and Wave 3 so far, Wave 5 would be expected to be longer than Wave 3, indicating that the SPX would move much higher than current levels.

So again, I am looking for 3 waves higher from 1814.36 to complete this Wave 3. Looking at the action from that low, 3 waves can be counted as 1884.89-1850.61-1888.59, which was today’s high. The count of 1850.84-1814.36-1884.89-1850.61-1888.59 satisfies the parameters for a completed sequence from 1814.36. A move below 1850.61 would most likely confirm this count, and signal the end of Wave 3 from 1560.33. It is also possible at the moment that the 1884.89-1850.61-1888.59 move is only the first 3 waves of Wave 3 of 3 of 5. A move above 1888.59, without violating the 1850.61 low, would increase the likelihood of this scenario.

As I mentioned above, this would require one more move higher for the SPX, a move that should exceed the 242 point length of Wave 3. I am still not completely sold on the idea of another 250 +/- move on the SPX, and there is another count that suggests that today may have marked the completion of a larger degree wave. This count would indicate that the SPX may be near, or may even have completed, the sequence from 1074.77.


This is a count I spoke of back in October (http://5wavemodel.blogspot.com/2013/10/mondays-market-10142013.html). Whereas the count above counts the first three waves from 1074.77 as Wave 1(1292.66), Wave 2(1158.66), Wave 3(1422.38), followed by an inverted corrective Wave 4 which completed at 1560.33, this alternate count is slightly different. This has 1292.66 as Wave 1, 1158.66 as Wave A of 2, and 1422.38 as Wave 1 of B of 2. The next 5 waves are the same in each case, with 1266.74-1474.51-1343.35-1687.18-1560.33 completing an inverted corrective wave, only of differing degrees. In this alternate count, this is Wave 2 of B of 2. Waves 3, 4, and 5 completed as 1709.67-1627.47-1729.86, and completed Wave B of 2. 1646.47-1850.84-1814.36 then completed Waves C, D, and E, and Wave 2 from 1074.77. Just as in the first scenario the SPX now needs to complete 3 waves higher from 1814.36, but this time those three waves will complete a sequence from 1074.77.

The three waves I outlined in the first example, 1884.89-1850.61-1888.59, also satisfy the parameters for the completion of this wave. The same caveats apply to this scenario as they do in the first.

The only difference between these two scenarios is the move from 1709.36 to 1627.47 following the initial rise from 1560.33. I had originally counted this as a single 5 wave sequence, and later changed it to three separate waves, 1639.43-1669.51-1627.47. This move was quite choppy, which made it difficult to track with complete certainty. If my original count was correct, and it was a single move, the alternate scenario of this being the completion of the wave from 1074.77 is the most probable. If it is three waves, the first scenario is the most probable. In either case, I would expect a move lower to begin soon, with the main difference being the degree of that move lower.