Tuesday, February 28, 2023

TSLA Tuesday Update 02/28/2023

 If you read Monday's Update, you had a pretty good roadmap for today's session. In that update I said I was expecting a move higher at the open, followed by a 6-8 point pullback. TSLA did open higher, gapping up and hitting a high of 211.23. It is notable that it stopped just shy of the 212 lower bound that would end the sequence from the 101.81 low. It is nice when a forecast comes to fruition, but obviously they will not all be that good. But the accuracy does speak to the forecasting power of my model. Some set-ups lend themselves to highly accurate forecasts, while others are more difficult. I thought I would walk through what I saw yesterday in the set-up, and how I was able to arrive at those forecasts.


Going into today's session, this was the set-up. On the lower left side of the chart you will see a 4 on the 22nd. I will start there. My count has Wave 1 completing on the open of the 23rd. The next labels you will see are for Waves A, B, and C. These are the first 3 waves of a 5 wave sequence. From Wave C, there are labels for the first three waves of a lower level sequence, Waves 1, 2, and 3. After that another sequence with Waves A, B, C, and D labeled. From Wave D, you will notice a slight pullback into the close. My model is based on a simple premise: Namely that when waves are taken as points, with coordinates (Startpoint, Endpoint), and a linear regression is applied to those waves, a wave completes when the first, third, and fifth waves of a sequence have an R^2 value above .99.

I will start with the final A-B-C-D sequence on the chart. The previous Wave 3 is our start point, so we have 197.67-194.00-208.22-204.22-209.42. Taken as points, that gives, (197.67, 194.00), (208.22, 204.22), (209.42, X), where X would be the Wave E completion point. The pullback at the end of yesterday's session had a low point of 206.35. Using that as X, the resulting linear regression gives an R^2 value of .9952, above the .99 threshold. This allowed me to consider that as the endpoint of the sequence.

The A-B-C-D-E sequence was then the end of Wave 4 of the 1-2-3 sequence started on the 24th. So we have (192.80, 195.67), (193.58, 197.67), (206.35, X). The minimum value for X that gives an R^2 value above .99 for that regression is 208.02. This gave a me a minimum value for today's opening move up. The high of that move, 211.23 gives an R^2 value of .9955.

That opening move to 211.23 thus completed the 5 wave sequence from Wave C on the 24th, or Wave D. Given the four completed waves, the sequence is (205.14, 196.33), (203.28, 192.80), (211.23. X). Being able to infer today's opening move allowed be to extrapolate that into the 6-8 point pullback, since it would be completing the inverted corrective wave starting with Wave 1 on the 23rd. The pullback to 203.75 was just under 8 points, and gave the sequence an R^2 value of .99086.

The final count after that is shown here:


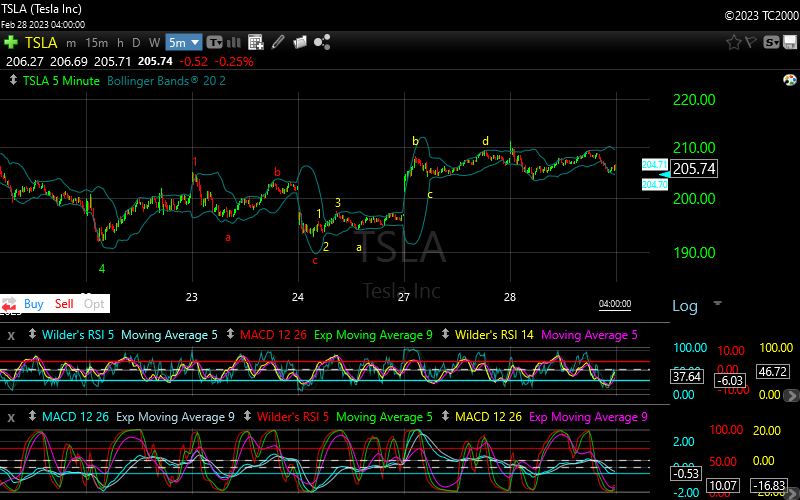
Looking at today's action, we had the opening rise to 211.23, followed by a pullback to 203.75. That sequence looked like, (211.23,206.43), (208.43, 204.71), (206.19, 203.75), with an R^2 value of .99038. From there the market moved higher again, tracing out a five wave sequence as (203.75, 206.33), (204.86, 207.88), (206.31, 209.41), with an R^2 value of .99357. After that TSLA moved lower, dipping to 204.91, before trying to rally into the close.


In my current count from the 101.81 low, TSLA has now completed four waves of a five wave sequence, with Wave 4 completing at 191.78. Today's low would be the completion of Wave 2 from that Wave 4 low. With four waves completed, we can project Wave 5 to complete between 212, and 234. That remains my current target. Some of my work shows a convergence around 229, but any move between 212, and 234 would be sufficient to complete the sequence. The 191.78 Wave 4 low would be a critical point. A move below that would require a revision to the current count.

Help fund to further research.

Monday, February 27, 2023

TSLA Update 02/27/2023

 Friday saw a gap down for TSLA, falling to 192.80 shortly after the open. TSLA then traded in a narrow range, with a slight upward bias, throughout the day. The fact that Thursday's 191.78 low held was important, as that is my Wave 4 low, and a break below 187.61 would invalidate the count, and likely mean a top was in. After holding those levels, TSLA moved markedly higher at the open, gapping up to 208.22 before a slight pullback. Another move higher brought the stock to 209.42, which proved to be the high of the day. From there TSLA fell slightly into the close, ending the session at 207.60.


A very short term count would call for a move higher from the close, followed by a pullback of 6 to 8 points. This move higher has a lower limit just below today's high, but the upper limit gives it a large range to work with. That would set up a final move into the 212-234 target area mentioned Thursday. On a cautionary note, another move higher at the open could put TSLA in that target range, so close monitoring will be needed from this point. One possibility would be for the initial move higher to carry to a point where the 6-8 point pullback keeps it above the 212 target. 

On the downside, I am watching the 191.78 and 187.61 levels. A break of those would seem to be near term bearish. Should be an interesting couple of days.

Contribute to further research,

Monday Update 02/27/2023

 In Thursday's Update I mentioned the possibility of another move down for SPY, probably below 396, followed by a move higher. Friday opened with a gap down, opening just below that 396 level at 395.54. Most of the day was spent bouncing around the 394-396 level, with only a couple of failed attempts to break through that 396 level. Today opened on a firmer note, with SPY gapping up back to the 400 level. I have also mentioned 402 as a near term resistance level, and SPY reached 401.29 before spending the rest of the session giving back most of those gains, falling back to 396.75 before rallying slightly into the close.


 Friday's drop below 394 was slightly more than I was anticipating, which again still leaves several possibilities from this point. There is still short term resistance at the 402-403 level. The primary short term count still calls for SPY 406-411, but the 402-403 may be all it can muster. 

Contribute to further research.

Thursday, February 23, 2023

TSLA 02/23/2023

 TSLA continued the rally off yesterday's low at the open. A gap up brought it to 205.14. That proved to be the high of the day, as TSLA soon dropped back to 196.33, before working higher through the afternoon, closing at 201.99.


My count from yesterday's update remains the same, as I am still looking for a move to 212 - 234. Please help fund further research.

Thursday's Market Update.


Thursday Market Update 02/23/2023

 After finishing yesterday's down day in decidedly oversold territory, they market started with a bang today. A gap up opening took SPY to 402.20 within the first half hour. That initial enthusiasm soon faded, as SPY then tracked down below yesterday's low to 396.35 just after noon. After that the market regained it's footing and rallied back near the opening high to 401.62, before selling off slightly at the close. It fell back near the 400 level at 400.41 before closing at 400.64.


When the market opened higher above the 402 level, it looked like we were on our way to the 407 - 412 area I mentioned yesterday. But the decline below yesterday's low took care of that in a hurry. The start of this wave from 418.31 was choppy, and so several  counts are possible. One such count I outlined above, as the February 14-16 action can be counted as A-B-C of an inverted corrective wave. Today's opening move higher was Wave E and the decline then finished Wave D from the 14th. The conservative count from here still calls for a move to 406 - 411, followed by another move lower, probably below 396. 

A second count would call for a move back down to the 396 level from here, before commencing the rally to the 406 - 411 level. A third count points to today's low as being the completion of a 5 wave sequence from the 418.31 high.

The 402 area has proven to be a resistance area, and you will notice that many of these wave options see that as a significant point. The same can be said for the 396 level. The 406 - 411 level seems to be the next area of interest. If that level holds, a move down to 396 looks probable. A break above that level could point to today being the end of the 5 wave sequence.


Wednesday's Update

Contribute to further research.

Wednesday, February 22, 2023

TSLA Update 02/22/2021

 I was a little early on the Wave 4 low the other day. Today's low of 191.78 still keeps the count intact, with the only change being a slight change to the Wave 5 high. I would now set my target between 212 - 234.

Both the RSI and MACD look positive after today's action. 


Wednesday Market Update

Market Update 02/22/2023

 Given the oversold conditions the market closed at on Tuesday, it would not have been unexpected for the market to attempt a rally this morning. Initially it did, as the market opened slightly higher to just above the 400 level. That was short-lived however, as the market soon resumed it's downward trajectory, falling once again below the 400 level to 397.62. Another, more sustained rally took hold from there, and the market enjoyed a steady rise to near the 401 level ahead of the Fed Minutes. The market swung higher and lower immediately following the release of those minutes, before again deciding on a downward path. SPY once again tested the 397 level right before the close, before rallying to close at 398.60.


Yesterday I mentioned the shorter time frame charts being noisy. Today's action seemed to clarify some of that, and while still noisy in spots, some things have come into clearer focus. Counting from the recent 418.31 high, I am counting the initial move down to 407.57 as Wave 1 of this move lower. The market then moved in sideways fashion to 416.49 - 405.01 - 415.05, which can be counted as Waves A - B - C of an inverted corrective wave. After that, the entire move down to today's low of 397.02 can be counted as a 5 wave sequence for Wave D.


In the short-term this count implies a move higher. Given the structure of the inverted corrective wave to this point, the Wave E target would be between 407 - 412. From that point we may see another move down. My work still shows a downside target somewhere below 396. For now I'll leave it there and follow this a wave at a time.

If you find value in this analysis, please consider a donation to help us continue our research.

TSLA Update


Tuesday, February 21, 2023

Tuesday's Market 02/21/2023

 The market got off to a rocky start with a gap down opening. SPY hit 403.15 shortly before the open, and made a feeble attempt at a recovery during the opening 15 minutes. This recovery could only lift SPY slightly more than a point before it resumed to the downside. This slide lasted into the afternoon with hardly an attempt at a rally. SPY fell below the 400.00 level dropping to 398.82 before another attempt to the upside was mounted. The 400.00 level then turned into resistance, as SPY topped at 400.16 before falling once again into the close. It closed at 399.14, only slightly above the worst levels of the day.

Looking at the daily chart, one can count a completed 5 wave sequence from the 10/13/2023 low of 348.11 to the 2/2/2023 high of 418.31. This sequence can be counted as 348.11-390.39-368.79-410.49-374.77-418.31. This sequence has an R^2 value of .9965, which satisfies my model. 

The first thing I notice about this sequence is that it lacks an extended corrective wave, which one would normally see during an impulse wave. Thus it give the appearance of an A-B-C correction from the 348.11 low. If one draws a tend line connecting the 348.11 low and the 374.77 low, one will notice that the market came very close to that line today, indicating that we may be at an important juncture. 

Technically, the Daily SPY chart shows an oversold condition on the RSI, but the MACD shows a bearish crossover. 

The shorter term charts have been less clear. One possible count shows a short term 5 wave sequence could complete between 396-386, but the technical action may provide better clarity to shorter term direction. 


If you find this information valuable, please consider a donation so we may continue our research.

One More Move Higher for TSLA?

 TSLA has been on a relentless tear since putting in a low at 101.81. After an initial move higher to 123.52, TSLA moved sideways, bottoming at 115.60. From that point it was almost a straight line up to 214.00, with only short pauses along the way. Once hitting 214.00, TSLA had a slightly deeper correction to 187.61. That did not last long, however, as the stock quickly recovered and out in a new high at 217.65.

My analysis shows Wave 3 of a 5 wave sequence completing at that 217.65 high. The subsequent pullback to 197.50 was likely Wave 4, with Wave 5 currently underway. If this count is correct Wave 5 should carry TSLA to a new move high. The maximum price for the sequence as described would be 240.00.

TSLA appears to be in Wave 5 of the current 5 wave sequence, and should complete this sequence between 217.65, and 240.00. A move below the previous 197.50 low would likely mean that the sequence has completed. After this move, I would look for a more substantial pullback.


 If you find this analysis helpful, please donate so I can continue bringing it to you.