Saturday, September 21, 2013

Weekend Outlook 09/21/2013

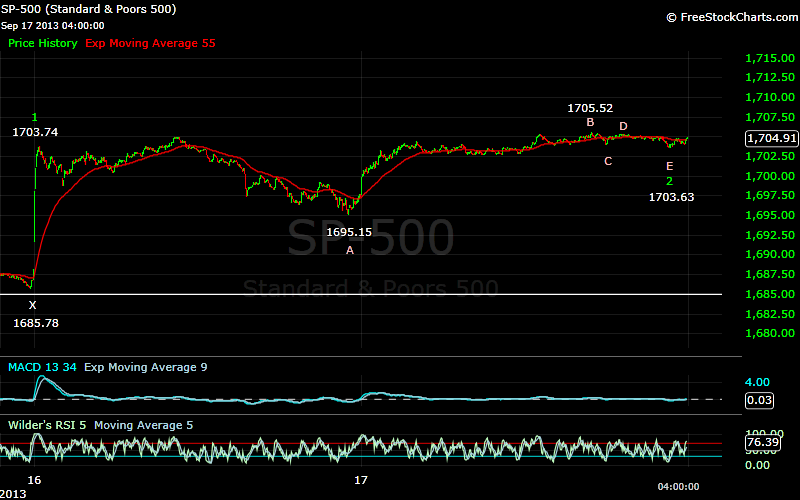
It was another interesting week for the markets, as all eyes were on the FED. Monday opened with the SPX gapping higher, up to 1703.74. The index then traded sideways up until the announcement Wednesday afternoon. Immediately following the announcement the SPX ran up to 1729 on Wednesday, and followed it up with a slightly higher high on Thursday at 1729.86. It was all downhill after that, as the SPX relinquished most of its gains by the close on Friday, dropping back to 1709.


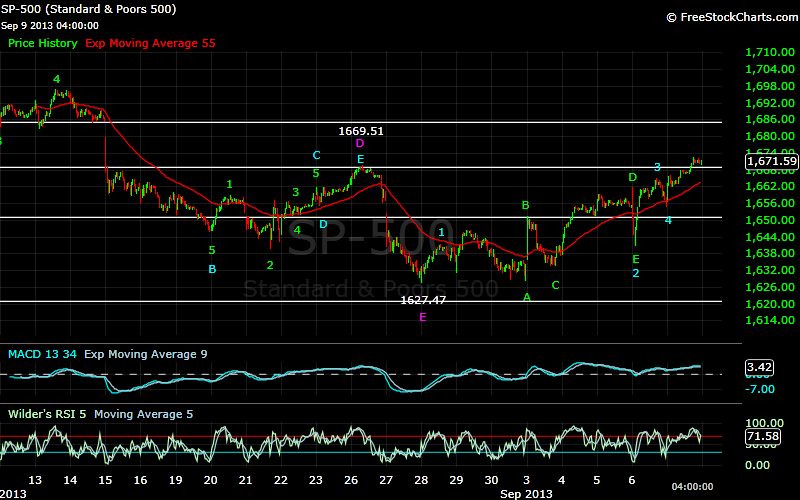
As I mentioned last week, the SPX has now entered the range to complete 5 wave sequence from the 1627.47 August low. However, there are some indications that the market will make at least one more move higher before it actually completes that sequence.

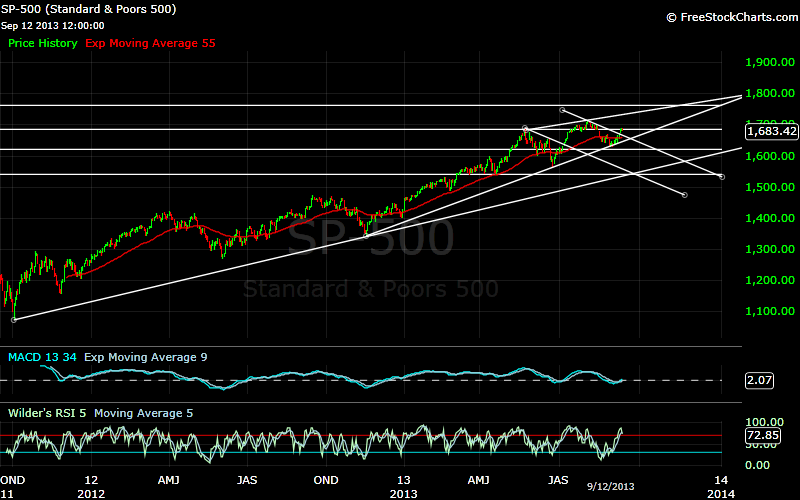
I have been looking at a target of 1776 to complete a sequence from the October 2011 low of 1074.77. By my count the SPX is now in the third wave of a sequence from 1560.33 that will eventually complete that sequence. The first wave of this sequence completed at 1709.24, and the second at 1627.47. From that low, my count has four waves completed as 1641.18-1640.62-1664.83-1681.96. The fifth wave of this sequence has been difficult to follow on a short term basis, but a look at the longer term count can possibly clarify things to some extent.

Since the minimum target to complete the longer term wave from 1074.77 is 1776, the shorter term waves would also need to project into the same area. If the third wave completed at 1729.86, and this pullback has already carried down to 1708.89, the maximum target for wave 5 would be 1765, short of the 1776 target. For this reason, I would still expect another move higher, perhaps to 1745, before this wave ends. A move to 1745, followed by a pullback to around 1700, still seems to be the most likely scenario.

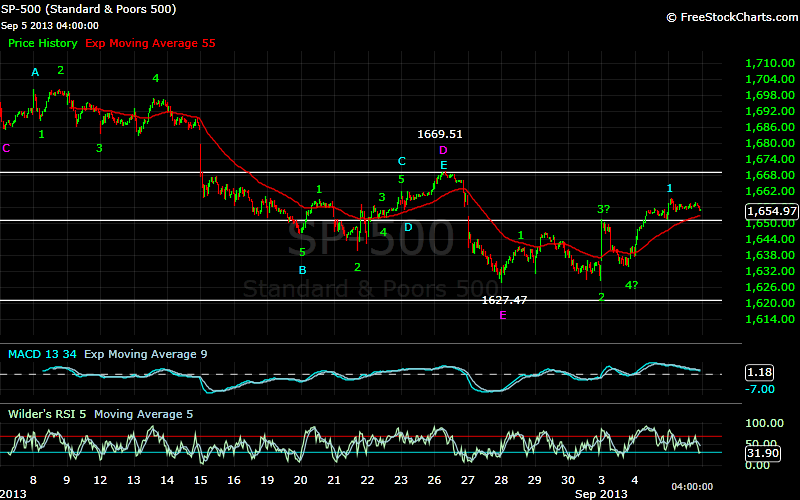
There a two possible short term counts for this wave which would project into the 1776 range.  The first is my original count, with 1703.74 being wave 1 of wave 5 from 1627. This would allow for the SPX to move slightly lower and still project to 1745. The second involves wave 1 ending before 1703.74, which was then followed by a complex inverted corrective wave. This scenario does fit better from the technical side. The complex corrective wave would have to have ended at Friday’s 1708.89 low, so if the SPX moves lower on Monday, this scenario would be out the window.

It still appears most likely, from my analysis that the SPX should move higher, possibly to 1745, and then be followed by a pullback to near 1700. One final move higher to above 1776 would then complete the entire sequence from the 1074.77 low.


Wednesday, September 18, 2013

Wednesday's Market 09/18/2013

The SPX opened slightly higher, and continued slightly higher into mid-morning. At that point it turned slightly lower, dropping below yesterday’s late afternoon low, and nullifying my very short term count. The index continued moving lower until mid-day, when it started moving higher in anticipation of the FOMC statement. After the release of the statement, the SPX moved sharply higher, making a new all-time high, and reaching 1729. After that, the index moved lower into the close.


As I mentioned, the move lower this morning made my very short term count from 1681.96 incorrect. I still see this as a wave 5 from the 1627 low, which has now moved above the minimum target level. It would appear that this wave has not yet completed, and I continue to look at the 1745 optimal target level as a possibility. I would expect the current wave to end before reaching 1776. Should the market move above that level, the possibility exists that the entire wave from 1074.77 is completing.

Tuesday, September 17, 2013

Tuesday's Market 09/17/2013

Having completed a semi-inverted corrective wave from Monday’s explosive opening late yesterday afternoon, the SPX was poised to move higher this morning, and it did. Today’s open was more muted than yesterday’s, but the index moved steadily higher, moving up to 1704. After a small pullback the SPX advanced again, this time to 1705.24. Another pullback was followed by a third move higher, with the index reaching the high of the day at 1705.52. This completed a 5 wave sequence from yesterday’s late afternoon low. After that the index completed three waves down at 1704.03-1705.33-1703.63 before moving higher into the close.


It now appears like the semi-inverted corrective wave that completed yesterday was but the first wave of an inverted corrective wave that completed this afternoon at 1703.63. Interestingly, this is the same structure that started this entire rally from 1627. By my count, the SPX has now completed wave 2 of 5 from that 1627 low. It would appear that the index is in the final stages of this wave. My target remains at 1745, but that is my optimal target. The minimum target, given my interpretation of the wave structure, would be 1713. A fairly wide range to be sure, but that is usually the case with a wave structure such as this, with the impulse waves increasing in length. Sometimes the smaller degree waves can narrow the range, but with only two waves of wave 5 completed, that is not the case at the moment.

I have been looking for this wave to end near 1745, and then be followed by a move lower to around 1680. As I said, the exact end of the current wave is difficult to pinpoint, but this has been a rather extended advance, and the risks of a pullback are growing. It is important to note that the 1680 number should not be taken as a target, but as a guideline at the moment. It is just as likely to see a shorter pullback, and then a continuation of the advance into the 17733-1776 area. I am content to see how this plays out over the next couple of days, or through the completion of this wave.

I am looking for the current wave from 1627 to complete above 1713, with an optimum target of 1745. Support remains at 1685, 1669, and then 1661.


Monday, September 16, 2013

Monday's Market 09/16/2013

It was another gap up open for the SPX, as the index moved above 1700 for the first time since early August. After moving up to 1703.74 after the open, the SPX pulled back to 1698.77, and then made one more push higher to 1704.95. After that the index moved steadily lower, dropping to 1695.15 before moving a bit higher into the close.


It still appears that the SPX is in a wave 5 from the 1627 low, with a target of 1745. I see wave 4 having completed last Thursday at 1681.96. From that point, it looks like the index completed a sequence this morning at 1703.74, and then formed a complex corrective wave into the afternoon low of 1695.15. This looks to be waves 1, and 2 of this 5th wave.

Support remains at 1685, 1669, and then 1651.


Saturday, September 14, 2013

Weekend Outlook 09/14/2013

Last Friday, with the SPX at 1655, I targeted the 1680-1687 range as a possible battleground for the bulls and the bears. On Tuesday morning the index moved above 1680, and the remainder of the week was spent between 1678.29, and 1689.97. On Wednesday the SPX moved above 1687.18, the upper limit for my semi-inverted corrective wave scenario that would have targeted a move lower to below 1560. This means that it is most likely that the index will continue higher, likely taking out the 1709 all-time high.


This has been a trying week for bulls and bears alike, and it seems only fitting that the market should head into the weekend without a clear resolution. I am still looking for the market to move higher, but I would feel more confident if the SPX could clear this 1685 support zone with some authority. Nevertheless, the SPX has moved above what I consider a critical level, 1687, and the wave structure still supports a move higher.


From the 1627.47 low, the SPX completed a 5 wave sequence to 1641.18. From that point, it formed a semi-inverted corrective wave that terminated at 1628.05. It was at this point that I indicated the index was poised to make an extremely powerful move to the upside. This semi-inverted corrective wave turned out to be but the first wave of an extended inverted corrective wave that eventually completed at 1640.62. So from 1627.47 the SPX has completed a wave 1 at 1641.18, and a wave 2 at 1640.62. The next move higher was to 1664.83, and looks to be wave 3 from 1627. This was followed by another inverted corrective wave that completed wave 4 at 1681.96. This gives an optimal target of 1639 for wave 5, very close to my original 1645 target.

When the SPX moved off its 1560.33 low in late June, I set a target of 1776. This target came into question as the index pulled back off the 1709 high, and eventually found its way to 1627. In my post on 9/4/13, http://5wavemodel.blogspot.com/2013/09/wednesdays-market-09042013.html, I outlined a scenario where the SPX could still reach that target. This entails the index forming 5 waves from the 1560 low that would complete a sequence from 1074.77 at 1773. These waves would go something like 1709.24-1627.47-1745-1680-1773. Given the discussion above, this seems to be a likely scenario. This would not complete a sequence from the 666.79 low, so there should be at least one more move to the upside after that.

For the week ahead, I am looking for a continuation of the move higher from 1627, with a target of 1745. My current wave count requires the SPX do hold above 1682. A break of that level at this point and the index could correct further, with support at 1669, 1651, and then 1621.


Thursday, September 12, 2013

Thursday's Market 09/12/2013

The SPX opened slightly higher this morning, moving up to 1689.29 before pulling back. After falling to 1685.71, the index turned higher, reaching 1689.97. After that, the SPX spent the rest of the day working its way lower, falling to 1682.30, and then bouncing to 1687.39 before falling back to 1681.96 just before the close.


Today’s 1689.97 high appears to complete the sequence from the 1654.45 low. The possible inverted corrective wave 4 I mentioned yesterday seems to have been incorrect, with the SPX actually completing a smaller degree wave sequence from 1678.29 to today’s high. From 1627.47 the market has now completed a sequence to 1641.18, which I see as Wave 1, followed by a complex corrective Wave 2 which completed at 1640.62.

From there I had been counting 1664.83 as Wave 3, 1654.45 as Wave 4, with Wave 5 possibly completing above 1683. With a 5 wave sequence from 1654.45 having now completed, it is possible that the SPX has reached at least a short term high. However, the entire move from 1640.62, Wave 2 from 1627, until today’s low at 1681.96, looks technically like a single wave. This would fit the inverted corrective wave scenario I spoke of yesterday, or the move from 1640.62 to 1654.45, was of a lesser degree than the move from 1627 to 1641.18. At the moment this scenario seems more likely.

This is supported by the move from 1664.83 to today’s low counting as an inverted corrective wave of some degree. This would mean the SPX should move higher off today’s 1681.96 low. This wave could possibly carry to 1676.70, but would more likely move higher from the open.

If the SPX moves below 1676.70, it would be most likely that a top from 1627 has been put in at 1689.97, and a pullback would then be expected. I think it more likely that the SPX will continue higher from this point, with 1745 remaining a likely target.

Support is at 1685, 1669, and then 1651.


Wednesday, September 11, 2013

Wednesday's Market 09/11/2013

The SPX opened to the downside this morning, slipping to 1680.90 before bouncing back to 1683.29. Another dip took it to 1678.70, just above the 1678.29 Wave 4 low I had mentioned yesterday was a critical level to watch. From there the index moved steadily higher, topping at 1688.13. Another dip took the SPX down to 1685.09, before a final push higher into the close took the index to 1688.59.


Although on the surface this appeared to be a fairly typical trading day, it is noteworthy for several reasons. The SPX fell to 1678.70, but remained above the critical 1678.29 level, which means my current count has not been invalidated. The index also rose above 1687.18 May 22nd high. This means that the semi-inverted corrective wave, which would have indicated a move down to below 1560, is no longer applicable. This does not mean the market cannot go down, of course, simply that the given scenario no longer is possible. Lastly, the SPX did not enter the 1690-1697 range that would likely have completed both a 5 wave sequence from both 1654.45, and 1627.47.

Looking at the wave structure from 1683.77, which I see as Wave 3 from 1654.45, it now looks like the SPX has completed a complex corrective wave from that point, to today’s 1685.09 late afternoon low. This is unusual since Wave 2 was also a complex wave. Normally only wave 2 OR wave 4 is complex, but rarely both. If this is indeed the case, it has the effect of raising the upper limit for wave 5 to 1708. This would be above the upper limit of wave 5 from 1627 as I currently have it. If the wave from 1654 does complete above 1700, it would open the possibility that the wave from 1627 is also undergoing a complex wave 4, even though wave 2 was a complex wave. If so, the market could undergo a small correction, and then target Wave 5 from 1627 at 1745, the other target level I have been mentioning. This seems to fit quite nicely.

If this works out, the SPX should put in a near term top between 1700 and 1708, undergo a pullback that should hold above 1668, and then move up to 1745.

1678.29 remains a critical level, as a drop below that could mean the SPX has made a short term top. The probabilities now favor a move to new highs, with a target of 1745. That, of course, is not the same as saying that the market cannot go down. The SPX has now risen over 60 points from the 1627.47 low, and some short term indicators are now in overbought territory. Support is at 1685, 1669, and then 1651.

It would be nice to see new all-time highs, as that would increase even further the probability of an additional move higher, it looks like that confirmation signal may have to wait. At the moment I would look for at least a short term high from 1690 to 1708. Exactly where that top occurs may give further insight into the longer term outlook and wave structure.


Tuesday, September 10, 2013

Tuesday's Market 09/10/2013

The SPX gapped up again this morning, and barely looked back. After hitting 1681 shortly after the open, the index continued higher until it reached 1683.77. From there the SPX pulled back 5 points, and then worked its way back to the intra-day high, and then surpassed it at the close.


I have been outlining two scenarios lately, one which has the market moving to new highs, 1745, and the other which has the SPX resuming its downtrend to below 1560. I have stated that the 1680-1687 range would be the battleground, and today the index found itself within that range. A top in this area would point to a continuation down to below 1560, while a move above 1687 would indicate a move to new highs.

  I have been looking at two wave sequences, with the first being from the 1627.47 low. Wave 1 of this wave completed at 1641.18, and was followed by a complex corrective wave that completed at 1640.62. Wave 3 completed Friday at 1664.83, and Wave 4 at 1654.45. This gives a target for Wave 5 above 1683. The second is from the 1654.45 Wave 4 low. Wave 1 of this 5th wave completed at 1666.15. After a complex corrective Wave 2, this ended yesterday at 1670.01. At the moment it appears that the move above 1683 today only completed Wave 3 of this sequence. The pullback to 1678 then looks like Wave 4, but the SPX has yet to complete Wave 5.

The upper limit of the wave from 1627.47 is 1699, and I can now give a target range for Wave 5 of this sequence as 1690 to 1697. It now appears quite likely that the wave from 1627 will complete between 1690 and 1697, above 1687, and would indicate a move to new highs. I will be looking for a move above 1687 to confirm this scenario. If the SPX moves below 1678.29, the Wave 4 low, before moving above 1687, my short term count from that low is probably wrong, and the more bearish scenario would be in play.

A move above 1687 would indicate new highs, while a move below 1678, without moving above 1687 would most likely mean a move to below 1560.


Monday, September 9, 2013

Monday's Market 09/09/2013

The SPX gapped higher at the open, hitting 1663, and then 1666.15 after a small pullback. After reaching 1666, the index paused, dropping 4.5 points before resuming the move higher. The SPX rose steadily until late afternoon, rising to 1672.4, before spending the last part of the day trading sideways, between that high and 1670.01.


On Friday I said that it appeared the SPX had completed a 5 wave sequence at 1664.83, and another to the downside at 1654.45, indicating another move higher was likely. With today’s move higher, that seems to have been the correct interpretation. The move to 1666.15 this morning looks to be a wave 1, which was followed by an inverted corrective wave 2, which completed this afternoon at 1670.01. This would mean that SPX should make at least one more move higher.

By way of review, I have been looking at two possible scenarios for this wave. The first is that this is part of a complex correction from 1687 that would go something like 1687.18-1560.33-1709.24-1627.47-1685?-1540? This scenario would require the current wave to complete between 1680 and 1687. I erroneously stated on Friday that the SPX would need to drop further than Friday afternoon’s 1654.45 low for the current wave, as I have been counting it, to complete within that range. I apologize for that, as this wave from 1627.47, as currently constructed, could complete above 1683.

The second scenario has 1687.18 as a top, 1560.33 as a bottom, and a 5 wave sequence underway from that point that would go 1709.24-1627.47-1745-1680-1773. This had been the preferred sequence, as until Friday it looked as though the wave from1627 would complete above 1687. However, after I identified the inverted corrective wave on Friday, and the possibility of the SPX completing this wave between 1680 and 1687, both scenarios are at least equally likely, with perhaps a slight edge given to the first scenario.

There are a couple of reasons for this. First, there is a good possibility that this wave will complete within the 1680-1687 range. Second, if this wave does end there, the first support zone is setting up to be in the 1645 area. That would seem to be a pretty severe drop if the SPX were setting itself up for new highs. Also, many of the technicals are reaching overbought levels again.

As I said on Friday, the battleground is shaping up to be in the 1680-1687 range. If the SPX gets above 1687, I would be inclined to think that this market will continue higher. If the index gets into that 1683-1687 range, and then pulls back, it is likely that it is headed lower, most likely below 1560.

Shorter term, I am looking for the SPX to make one more move higher, to above 1683, and that should be followed by a pullback, as it would complete a sequence from 1627. Resistance is at 1685, with support at 1669, 1651, and then 1621.


Saturday, September 7, 2013

Friday's Market 09/06/2013

An unexpected consequence of today’s market action was the somewhat surprising reprisal of the semi-inverted corrective wave from 1687 scenario. I had discounted this over the past several days based on the minimum projection of 1693 for the wave from 1627. Today’s development once again makes this scenario possible, if not probable. I originally presented this scenario in this post: http://5wavemodel.blogspot.com/2013/08/fridays-market-08162013.html.


The SPX gapped higher to open the day, hitting 1661.81 before backing off. The sell-off was pretty steep, with the index shedding over 21 points in less than half an hour. After dropping to 1640.62 the SPX began to recover. The index rallied to 1661.46, then pulled back to 1657.63. Another push higher took the SPX to 1664.83, where it began to sell-off once again. The index fell to 1654.45 just before the close.

It would now appear that this morning’s 1661.81 high marked the end of a 5 wave sequence from Tuesday’s 1633 low. My call of yesterday’s 1659.17 high being the end of that sequence would seem to have been premature. Following that high, the SPX fell to 1640.62, which is where the unexpected consequence comes in. That low completed an inverted corrective wave from last Wednesday’s 1641.18 high. This wave completed as 1628.05-1651.35-1633.41-1661.81-1640.62. This makes it at least possible that the SPX could complete a 5 wave sequence from 1627.47 within the 1680-1687 range necessary for the semi-inverted corrective wave scenario to remain in play.

I had been counting the wave from 1627.47 as a wave 1 to 1641.18, a semi-inverted corrective wave 2 that completed at 1628.05, followed by a wave 3 to 1651.35, and a wave 4 to 1633.41. This would have projected wave 5 to complete at a minimum of 1693. If the SPX moves above 1687, it invalidates this scenario. It is now clear that the semi-inverted corrective wave was a wave A of 2.

It would have been better for this scenario if the SPX had stopped at today’s second high of 1661, and then pulled back. This would have projected a wave 5 right into that 1680-1687 range. If wave 3 of the sequence from 1627 was indeed today’s 1664.83 high, the market would need to correct further than the 1654.45 low we saw just before the close. However, it does appear that the SPX completed a 5 wave sequence from 1665 at 1654.45. If this is wave 4, it would again project a wave 5 above 1687.

The other scenario I have discussing has the SPX in the process of completing a 5 wave sequence from 1560.33 as 1709.24-1627.47-1745-1680-1773. I discussed this scenario in detail here: http://5wavemodel.blogspot.com/2013/09/wednesdays-market-09042013.html.

It appears that the SPX has at least one more move higher in mind, with 1680-1687 setting up to be the battleground. A move into that area, followed by a break to the downside would indicate a move to 1530-1560 is underway. A move above 1687 and the SPX should continue higher to 1745.

I will try to address this in more detail over the weekend.


Thursday, September 5, 2013

Thursday's Market 09/05/2013

The SPX opened virtually flat this morning, but quickly resumed its march higher, as the market rose to 1659. From there the index traded in a narrow range, dropping to 1654.55 by late morning. The SPX rose from that point to 1658 just before the last hour of trading. The index then slipped into the close, dropping below the previous low to 1654.49 just before the close.


It appears that today’s high of 1659.17 completed a 5 wave sequence from the 1633.41 low. The SPX looks to be in the third wave down from that high, which would indicate some further down side may be ahead. Short term support is at 1651, 1648, and then 1640.

Given my outlook for a move to 1745, it is also possible for the three waves down to be part of a complex correction. If this turns out to be the case, I would expect a move to the 1669 resistance area before a pullback.

 While the very short term direction of the SPX is difficult to discern at the moment, I am still looking for higher prices, with 1745 as my first target. At this point, only a break below 1627 would change this.


Wednesday, September 4, 2013

Wednesday's Market 09/04/2013

After opening slightly higher than Tuesday’s close, the SPX dipped briefly into negative territory before moving higher once again. The index climbed steadily to 1655.72 by mid-afternoon, before finally taking a breather. The SPX pulled back to 1652.51, then bounced back to 1655.35, before pulling back again to 1651.22 before the close.


Yesterday I presented three scenarios, of which the first one was the SPX holding above 1633, and then eclipsing yesterday’s 1651.35 high. I noted that if this scenario played out, I would expect the index to test the 1709, and possibly surpass it.

The larger scenario I presented yesterday was that the SPX was forming a semi-inverted corrective wave from the 1687 high. For this scenario to be correct, the SPX cannot surpass that 1687 high. I also noted that the current wave structure from the 1627.47 low pointed to a minimum target of 1693 for this wave. Given today’s action, it appears that 1693 would be the next minimum target, which would nullify the semi-inverted corrective wave scenario. The optimal target for this wave would be 1745, which makes a different scenario most likely.

As those who have followed me may remember, I had been looking for a minimum target of 1776 for the wave from the 1560 low. That would complete an entire 5 wave sequence from the October 2011 low of 1074.77. Using the optimal target of 1745 for this wave, it is possible to extrapolate a 5 wave sequence from 1560.33 as 1709.24-1627.47-1745-1680-1773. This fits quite nicely with my 1776 target.

On a shorter term horizon, the initial move to 1641.15 this morning appears to be a wave 1 from yesterday afternoon’s 1633 low. The SPX then completed an inverted corrective wave that went 1637.16-1655.72-1652.51-1655.35-1651.22. This also completed right at the 1651 support level. If this count is correct, the SPX should continue higher at this point. Resistance is at 1669, and then 1685. Support is at 1651, and then 1621. A move below 1634 would put this count in jeopardy, and a move below 1627 would invalidate it.


Tuesday, September 3, 2013

Tuesday's Market 09/03/2013

The day started off as expected, with the SPX gapping up at the open, and then continuing higher, stopping right at the 1651 resistance level. The index spent much of the remainder of the day giving back most of its gains. The SPX dropped steadily to 1633, and then moved higher into the close, reaching 1641 before pulling back slightly.


I had indicated in my last post that the SPX had likely completed a semi-inverted corrective wave Friday at 1628.05. This would result in a strong move higher, which occurred this morning. From that high, the SPX completed a 5 wave sequence to the downside, which completed at 1633.41. There were a couple of surprising things about today’s action, which I will now explain.

On August 16th, I posted this chart, which outlined a likely path for the SPX:


The entire post can be found here, http://5wavemodel.blogspot.com/2013/08/fridays-market-08162013.html, but essentially showed a semi-inverted corrective wave, such as we saw on Friday, from the 1687 high. This wave would have the SPX moving lower from 1709 to either 1651 or 1621, then rally to 1685, which would be followed by a final move lower to end between 1560, and 1542. This is one of several possible scenarios, but after the appearance of the semi-inverted corrective wave on Friday, which indicated a strong possibility of a rally to the 1685 level, this scenario once again seemed most likely.

As I said, the SPX would have to rally to near the 1685 level to project a final wave to 1560-1542. Today I was looking for a move up to 1645, followed by a small pullback, which would then target 1685. The first surprise today was that the initial move carried to 1651. The next surprise was that the ensuing correction seems to have ended at 1633. If the pullback to 1633 was wave 4 from 1627, wave 5 would project to a minimum of 1693, which would exceed the limit of 1687 necessary for this larger corrective wave scenario. Given the 1651 high, this corrective wave should carry below 1632.

The SPX is now at a point of decision, and what happens here should give an indication of what is to come. If the SPX holds above 1633, and then rallies above 1651, it seems likely that the index will test the 1709 high, and surpass it. If the SPX pulls back to 1632-1628, and then rallies above 1651, I would expect a rally to 1685, and then, possibly a decline to 1560-1542. If the SPX breaks the 1627 low before getting above 1651, 1542 might be an optimistic target.

At this point I would be inclined to expect a further rally, with 1685 being a good target level. I will, however be keeping a close eye on 1627.

I believe I have pointed this out on at least one other occasion, and the larger wave structure is not exactly analogous, but the decline from 1422 in April 2012, featured a drop to 1357.38, followed by a semi-inverted corrective wave which carried the SPX back to 1415, before a precipitous drop to 1266.74.