Let me be the first to admit that I was completely wrong about today’s market. I was looking for a continuation of the move up, and instead the market sold off in rather dramatic fashion.
The market gapped down, and soon found itself at the 1315 support level. But the market was still not done. After a brief rally attempt, the market continued down below the 1313 support, to 1309. At that point the market was done, spending the rest of the day moving steadily higher to 1316.60, before fading into the close.
The SPX broke some of my important levels today, first breaking through last Thursday’s low, then the 1323-1326 support, then the 1315-1313 support, and finally 1310.51, before the rout was over. The 1311 level was important because it was the wave 2 low from 1307. This means that either my counts were wrong, or something else has been going on since that low. I still think my current counts from 1267 are the best ones, and instead of totally disregarding those counts, I have to look at other possibilities. I did get the count wrong for Friday’s rally, as it is now apparent that the move from 1327 to 1337 was a 5 wave sequence.
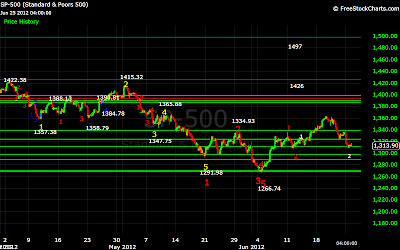
Although the SPX moved below the 1311 low, it did hold above the 1307 low. The simplest explanation, and one that keeps all of the 5 wave sequences thus far intact, is that the entire move from 1327.28, to today’s low of 1309.27, has been a semi-inverted corrective wave 2. I have super-imposed the labels to show that all the other sequences remain intact. An example of a semi-inverted corrective wave can be seen on the hourly chart. After the initial drop from 1422 to 1357, the market rallied to 1388, then formed a semi-inverted corrective wave to 1358.79. This count keeps all of my original projections intact, with 1393 being the most likely target for wave 3 from 1267.
From todays low, the market formed a 5 wave sequence to 1316.60. Short term resistance is still 1323-1326, with support at 1315-1313. Should the market fall below the 1307 low, a re-test of 1267 is probably next. At the moment I remain very cautiously bullish, but I will take it one step at a time.


Would you consider labeling your charts as to their time frame (daily, hourly, 15 min, 3 min, etc.)? Thanks, Bill
ReplyDeleteConsider it done, Bill. Hope this helps.
DeleteSteve
You expect a rebound to 1323-26. Looks like that is happening now. Will we have another 5-wave sequence lower in the short term or do you project a break above the 1326 resistance with further uptrend?
ReplyDeleteHi wavediver.
ReplyDeleteI expect a move to 1340,however the correction from the 1323-26 level could carry down to 1313. If the market falls below 1310, we might be on our way to 1397.
Steve