Monday, October 21, 2013

Monday's Market 10/21/2013

The SPX started off to the upside this morning, hitting another all time high of 1745.88. After a small pullback that closed the gap up open, the index hit another all time high, and the high of the day at 1747.79. This means my short term count from last Tuesday’s 1695.93 low was wrong. My original count from that low, which I changed on Friday, actually turned out to be correct. The high of 1747.79 then completed the sequence from that low, and a sequence from the 1646.47 low. From today’s high, the market completed a sequence down at 1741.71, a sequence up at 1745.41, another sequence down at 1740.82, and what appears to be another sequence up at 1744.52.


With a 5 wave sequence seemingly completed from the 1646.47 low, the SPX is at a decision point. A breakout to the downside here will likely signal a change in the short term trend, while a break above today’s high will most likely mean a continuation of this short term upward move. I have been looking for a top from 1646 to occur near 1745, and then be followed by a move lower to possibly 1680. This would fit my longer term outlook as I outlined over the weekend. A move above these levels would not alter that long term count, but would change some of the target levels. If the SPX does move higher, I will update my targets.

Support is at 1723, 1703, and then 1680.


Sunday, October 20, 2013

Weekend Outlook 10/20/2013

This week the SPX continued its seemingly relentless march to new highs. The index now stands nearly 700 points above the October 2011 low of 1074.77, and almost 1100 points higher than the 666.79 low of March 2009. The range of opinions as to where the market goes from here varies widely; some believe the run from 666.79 has been a corrective wave, with the market soon headed towards zero. Perhaps these are followers of Terence McKenna’s Time Wave Zero (http://www.levity.com/eschaton/waveexplain.html).  Others believe this rally will continue ad infinitum due to FED intervention. I believe the reality lies somewhere in between, with a medium term top near, but not imminent.

My analysis is based on a model I have developed, which I call the 5 Wave Model. Although there are similarities to Elliott Wave Theory, this is not EW. My model postulates that all movements of the market can be broken down into 5 waves, with a specific relationship developing between waves 1, 3, and 5 that indicate the termination of a “wave”, or trend. A specific proportionality manifests itself between these waves at the termination point of a 5 wave sequence.


Last week I mentioned a similarity between the current wave structure from the 1074.77 low, and that of the uptrend from October 2002 until October 2007, so I will start there. In addition to my wave counts, I have also numbered each wave of the uptrend consecutively for discussion purposes. The first thing to notice is that the uptrend consisted of 17 individual waves. The first 5 waves of the structure were 954.28-788.90-1015.33-960.84-1163.23. Since these 5 waves only had a correlation value of .96, it did not signal the end of a sequence. In fact, the first 5 waves that complete a sequence are waves 6-10. This sequence goes 1163.23-1060.72-1217.90-1136.15-1245.86-1168.20, and has a correlation value of .998. Since the impulse waves of this sequence, waves 1, 3, and 5 were to the downside, with the larger trend being up, this considered a corrective wave. With the end point of the fifth wave completing above the end point of the first, I call this an inverted corrective wave. After the completion of this sequence, the SPX rallied to 1326.70. Evaluating waves 2-3, 4-5, and 10-11, my model gives a correlation value of .999, once again signaling the completion of a 5 wave sequence. Then looking at waves 1-2, 11-12, and 13-14, the correlation is .9998, meaning the termination of another sequence, this time an inverted corrective wave. Finally then, from the October 2002 low of 768.63 to 1, 14-15, and 16-17, which takes us to the October 2007 high of 1576.09, my model shows a correlation of .9996, once again giving the end point of a 5 wave sequence.

In my 5 Wave Model vernacular this counts as 1-A-1-2-3-A-B-C-D-E(4)-5(B)-C-D-E(2)-3-4-5. This gives a total of 17 waves in which the first, third, and fifth wave of each sequence show a specific relationship.


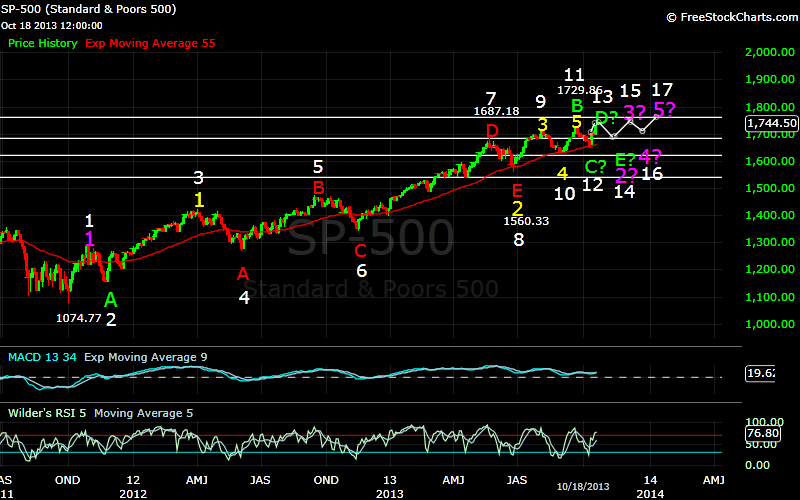
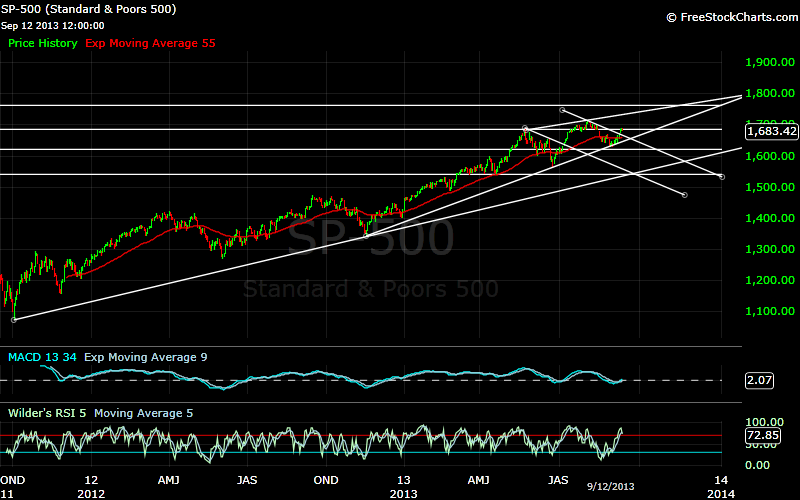
Next, I will look at the current wave structure from the October 2011 1074.77 low. Again I have overlaid a consecutive numbering system for discussion purposes. In the last wave, the structure started with a 1-A, followed by a 1-2-3 of one lesser degree. In this case wave 4 was the inverted corrective wave. This wave began with a 1-A, and was followed by a 1-A of one lesser degree. Wave 2 in this example proved to be the inverted corrective wave. In both examples, at the eleventh wave of the sequence, each wave had completed Wave B of an inverted corrective Wave 2 from the starting 
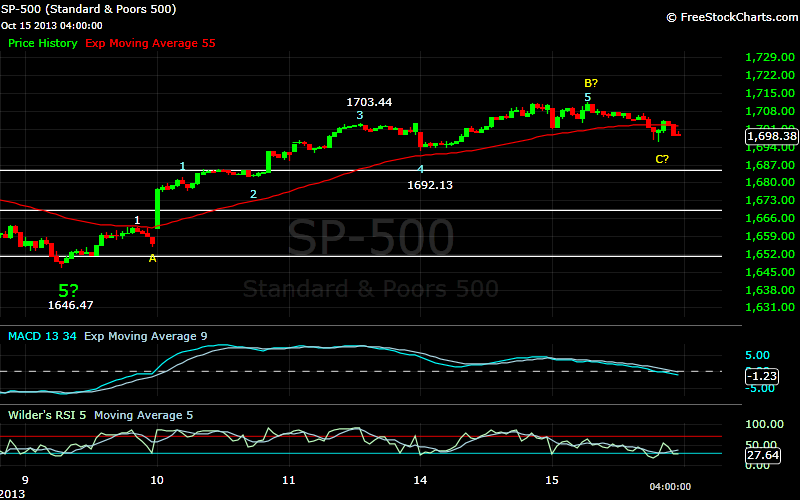
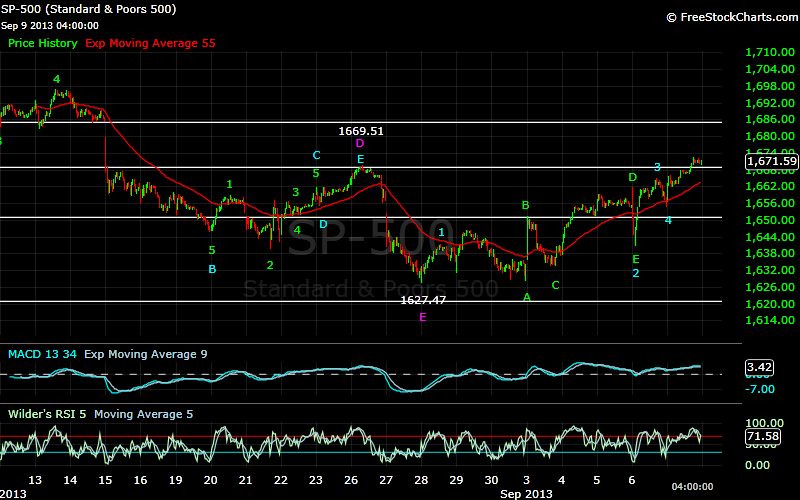
low. From that point, the current wave has gone on to complete Wave C at 1646.47, and now is at a level that would complete Wave D, or the 13th wave of what should be a total of 17 waves. As I have previously indicated, I would expect this wave to complete near 1680, and should hold above 1646.47. This would complete Wave2 from the 1074.77 low, and I would expect Waves 3, 4, and 5 to the upside to complete the entire sequence.


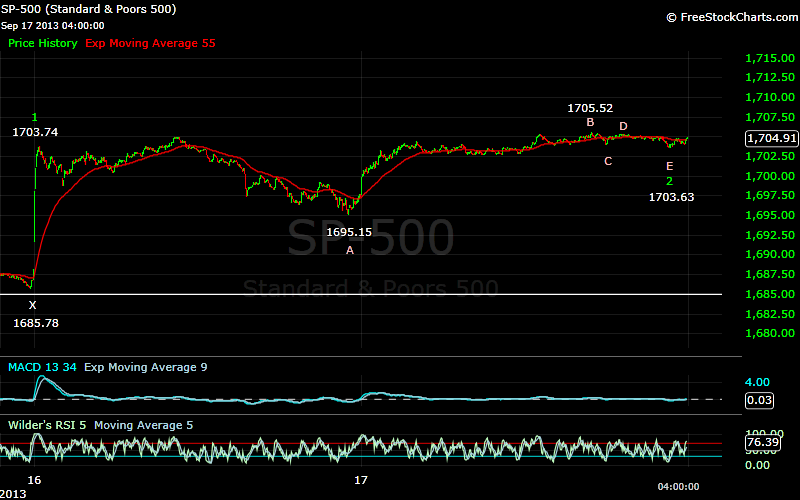
Finally, I also suggested last week that the Dow was on the same count as the SPX, but that while I expected the SPX to hold above its previous low, I do not expect the Dow to do the same. Both the SPX and the Dow have so far completed Waves 1-A-1-A-B-C-D-E(2)-3-4-5(B)-C, and possibly Wave D. Both indices are in inverted corrective waves, and these waves can complete in different fashions. For these indices to maintain the needed relationship between Waves A, C, and E of this sequence, the SPX would need to hold above its previous low, while the Dow would have to move below it.

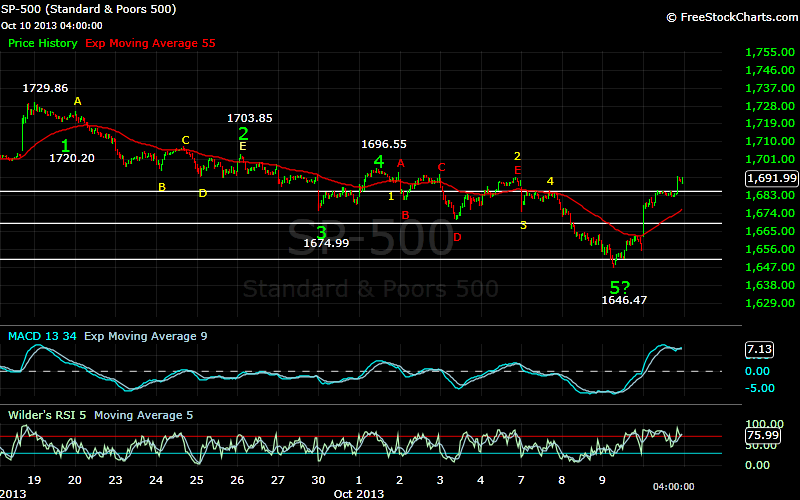
This could all change of course if the current rally from SPX 1646.47 continues. At the moment I would say that this wave will most likely end around current levels, setting up this diverging scenario.

Support is at 1723, 1703, and then 1680.

Friday, October 18, 2013

Friday's Market 10/18/2013

The SPX opened higher this morning, gapping up to 1738.69, and then continuing on to 1741.21 after a brief pullback. My count from Tuesday’s 1695.93 low has been a bit messy, with it now looking like wave 1 from that low completed at 1721.75. An inverted corrective wave 2 was next, and ended yesterday at 1725.93. Today’s higher open then completed wave 3. This was followed by a pullback to 1735.74. From there, the SPX rose steadily to complete wave 5. The index completed waves 1, 2, and 3 to the upside, which was then followed by an inverted corrective wave 4. This completed at 1742.82. Wave 5 then carried the index to a new all-time high at 1745.31.


This appears to complete a sequence from the 1695.93 low, which in turn completes a sequence from the 1646.47 low. I have been pointing to the 1745 level as a possible termination level for this wave, and it appears to have done just that. I would now expect the SPX to move lower, possibly down to 1680.


Looking at the longer term count, the SPX looks to have completed Wave D of an inverted corrective wave 2 from the October 2011 high of 1292.66. A move to 1680 would complete that corrective wave, and then be followed by waves 3, 4, and 5 to the upside.

Many have noted the continuing divergence between the SPX and the Dow recently. I have also been analyzing the Dow charts in an effort to account for the divergence. I have the two indices on the exact same count, with one important difference. Both, by my count, are in, or have just completed wave D of an inverted corrective wave. As I have discussed before, these waves can resolve themselves in several forms. Wave D on the SPX has now moved beyond Wave B. Thus I would expect Wave E to complete above the level of Wave C, or 1646.47. Another form the last three waves of this corrective wave can take is a zig-zag. It appears this is what is taking place on the Dow. Wave D does not look like it will move beyond Wave B, and this means that Wave E should complete lower than Wave C. In this scenario the Dow could make a new near term low, falling below 14719.43, while the SPX should hold above its previous low of 1646.47. It should make for an interesting market.

I will try to elaborate on all of the above over the weekend. 

Thursday, October 17, 2013

Thursday's Market 10/17/2013

The SPX opened to the downside this morning, falling to 1714.12. It appears I was a bit premature yesterday in calling for the completion of an inverted corrective wave at 1715.19. I would now say that 1715 was only wave C of that wave, with the bounce to 1722 being Wave D. The lower opening today would then be Wave E, and completed the inverted corrective wave 2 from Tuesday’s 1695.93 low. After the opening drop, the SPX rallied, moving to 1729.64. This looks to complete Wave 3, and was then followed by a drop to 1725.96 that would seem to complete Wave 4. The index rallied once again off that low, rising to a new all-time high of 1733.45 before fading into the close.


With 4 waves seemingly completed from the 1695.93 low, all that is left now is the completion of wave 5. This wave should complete above 1741, with an optimal target of 1746. This is very close to my ongoing target of 1745 for the completion f the wave from 1646.47. Yesterday I said I was leaning towards an alternate count for that wave, which now seems to be playing out. It is possible that 3 waves completed at 1662.47, as opposed to the single wave I had been counting. These 3 waves may have completed as 1646.47-1654.69-1651.02-1662.47. This was followed by an inverted corrective wave 4, which went 1654.81-1703.44-1692.13-1711.57-1695.93. This count yields an optimal target of 1745. Thus it appears quite likely that the sequence from 1646.47 will complete between 1741 and 1752, with 1745-1746 being the optimal target.


If this wave does complete within that range, I would then expect the SPX to move lower. As a rough estimate, I would be looking for a low near 1680. This fits well with my longer term count from 1074.77. I still do not see this as the end of this longer term sequence, but a continuation of the converging upward trend that has been in place since the 1560.33 low.

Support remains at 1723, and then 1703. A move below 1714 at this point could signal the end of this move.


Wednesday, October 16, 2013

Wednesday's Market 10/16/2013

The SPX opened higher this morning, jumping above 1710, and then continuing higher until it reached 1721.75. After that the index worked lower into the afternoon, falling to 1715.19 before rising near the high of the day towards the close.


The higher opening this morning supports the alternate count I discussed yesterday that an inverted corrective wave completed yesterday at 1695.93. The late afternoon rise to 1704.46 then completed a wave 1, with the pullback becoming wave A of an inverted corrective wave. Wave B of this wave completed at today’s high of 1721.75, very close to the 1723 resistance level I have been mentioning. The meandering pullback into the afternoon completed waves C, D, and E, and thus wave 2 from yesterday’s 1695.93 low. This means the SPX should now complete waves 3, 4, and 5 to the upside.


Looking at the count from the 1646.47 low, it does look like an inverted corrective wave completed from 1662.47 to 1695.93. I have added this count to the chart, which is denoted by the use of parentheses. This count continues to point to higher prices, and my target remains 1745. 1723 would be the last resistance level suggested by the previous wave structure, and if that level is cleared the SPX should be headed to new highs. Support is at 1703, and then 1685.

While it is difficult to pinpoint the exact high of this move at the moment, I have been looking for it to be above the previous high of 1729.86, with an optimal target of 1745. 

Tuesday, October 15, 2013

Tuesday's Market 10/15/2013

The SPX started the day to the downside, continuing the pullback from yesterday’s 1711.03 high.  After dropping to 1701.03, the index started to move higher, and made the high of the day at 1711.57. This was slightly above yesterday’s high, and right at the 1711-1713 level I pointed to in yesterday’s post as a possible high. This did not happen exactly as I thought, but the level turned out to be correct none the less. From there the SPX started to sell off, dropping back below 1700 to 1695.93 an hour before the close. The last hour saw the SPX rise to 1704.46 before settling back to 1698.06.


Continuing the count from last Wednesday’s low of 1646.47, today’s high would appear to be wave B of an inverted corrective wave, followed by wave C at 1695.93. If the move to 1704.46 was wave D, wave E would project to 1690. If D has not ended, the market should be higher from here before starting wave E down.

Considering today’s nearly 16 point drop from 1711.57 to 1695.93, another count has presented itself. The three largest pullbacks since 1646.47 have been 1662.47-1654.81, or slightly less than 8 points, 1703.44-1692.13, or 11 points, and 1711.57-1695.93, or 16 points. This may have completed an inverted corrective wave, and would point to a target of 1745.

I continue to see this market moving higher, with a target for this wave of 1745. Considering everything that is going on in Washington at the moment it is difficult to have absolute conviction on anything, but my wave count points to higher prices. There may be a continuation of the pullback before the index moves higher, but I would expect this to remain above 1685. A move below this level would mean my current assumptions are wrong.

Resistance is at 1703, and then 1723, with support at 1685, and then 1669.

Monday, October 14, 2013

Monday's Market 10/14/2013

Last Friday the SPX opened slightly lower, and then rallied to 1703.44. After a slight pullback, the index tested that high, but failed to surpass it. This was right at the 1703 resistance level. After failing to move above that resistance, the SPX opened sharply lower this morning, dropping to 1692.13 a few minutes after the open. This represented the largest pullback since this move higher began at 1646.47. That proved to be the low for the day, as the index continued to move relentlessly higher from that low, with the SPX moving above the 1703 resistance level, and continuing higher to 1711.03. From there the index moved slightly lower into the close.


The action today, after the 1692.13 morning low, looks like 4 waves higher, with an inverted corrective wave 2. I would project wave 5 of this sequence to end between 1711 and 1713. If my count from the 1646.47 low is correct, this should complete wave B of an inverted corrective wave 2. I have wave 1 as being the move from 1646.47 to Wednesday’s 1662.47 high. Wave A of the inverted corrective wave was the move from that high to 1654.81. The SPX has been in wave B of 2 since that point. If this is correct, the index should move slightly higher, to between 1711, and 1713, and then experience a pullback. Since this has not yet completed a 5 wave sequence from the 1646.47, I still expect the index to move higher, with 1745 being a likely target. If the SPX moves above 1713 without a pullback, another count may come into play that would target a high near 1740.


Starting last Monday, I have been mentioning that my longer term count from 1074.77 still requires some work to the upside to complete. As a picture is sometimes easier to visualize than words I have included a chart showing how I see this wave completing. This should not be taken as target prices or times, but simply the waves need to complete the sequence. By my count, the SPX is in Wave D of 2 from 1074.77. Again, these waves can complete in several ways, so these are not meant to be targets.


It is interesting to compare this chart to the chart from October 2002 until October 2007. The two are strikingly similar, and again, serves as a visualization as to how this wave will complete.


Thursday, October 10, 2013

Thursday's Market 10/10/2013

After testing the 1651 support level yesterday, and completing a 5 wave sequence to the downside from the 1729.86 high, the SPX rallied from that level, moving to 1662 during the afternoon. With a small pullback to finish the day on Wednesday, it looked like the market was set to rally. Rally it did today, gapping higher at the open, and reaching 1682 by mid-morning. It soon reached the 1685 resistance level, and then traded sideways until the last hour of trading. The SPX hit 1692.48, pulled back slightly, and then rose into the close.


I had set an initial target near 1700 for this move to the upside, which the market has nearly reached. From the 1646.47 low yesterday, it looks like the SPX completed the first wave higher yesterday at 1662.47. It appears that the pullback yesterday afternoon may have been wave 2, with wave 3 occurring this morning as the index rose to 1685.43. The sideways actions followed by the rise to 1692.48, and then the pullback to 1688.91 looks to then have completed an inverted corrective wave 4. This means a wave 5 would be expected next. Given the above scenario, the optimal target for wave 5 would be 1745. Some of you may recall 1745 as my target for the last uptrend. That time the market fell short of the target, but it is interesting how numbers seem to re-appear time after time. We’ll see if the SPX makes it to that level this time.

Since my longer term count has changed, the 1776 minimal target for the completion of the sequence from 1074.77 no longer applies. However, after the 1745 target I am expecting one more move higher, so we may still see that number.

Short term resistance is at 1703, and then 1723. Support remains at 1685, 1668, and then 1651.


Wednesday, October 9, 2013

Wednesday's Market 10/09/2013

The SPX opened slightly higher today, but quickly gave back those gains to move lower. Yesterday I said that a 5 wave sequence from the 1730 may have ended, but could move slightly lower, with the 1651 support level being critical. The index did test that support level, dropping below it to 1646.47, but then recovered. It appears that for now that level has held. From that low the SPX formed a 5 wave sequence higher to 1642.47. The first three waves completed as 1651.06-1649.47-1654.69. This was followed by an inverted corrective wave 4 that terminated at 1657.68. The fifth wave of this sequence then subdivided, and completed at 1642.47. It looks like three waves down completed at 1654.81. This would suggest an inverted corrective wave is forming, which would allow the SPX to move higher.


With the 1651 support level holding, it seems likely that the sequence from 1730 has completed, and I would expect a move higher. I am still looking at the 1700 area as an initial target.

Happy Birthday John.


Tuesday, October 8, 2013

Tuesday's Market 10/08/2013

I apologize for my dearth of posts lately. It has been a hectic month. I will try to get up to speed.

In my previous posts, I had stated that I was looking for a move to 1745, followed by a pullback to possibly 1680, and then another move higher to 1776 to complete a 5 wave sequence from the October 2011 low of 1074.77. That obviously to this point has not come to pass. The SPX fell short of my 1745 target, topping at 1729.86, and now has retreated to 1655. I still believe the sequence from 1074.77 has not completed, and the market should make at least one more move to new highs to complete that sequence.


The completion of this wave appears to be even more complex than I had originally thought. The above chart shows my original thought for this wave. This had the first three waves of the sequence completing as 1292.66-1158.66-1422.38, which was then followed by an inverted corrective wave 4 which completed at 1560.33. I was then looking for 5 waves to complete above 1776 to complete wave 5 from 1074.77.


Instead, it appears that the first 3 waves were not waves 1, 2, and 3 of a sequence, but rather Wave 1, Wave A of an inverted corrective wave, and another Wave 1. The move that completed at 1729.86 was the end of a 5 wave sequence from 1158.66, and thus Wave B of the inverted corrective wave. As I have stated in the past, Waves C, D, and E can then complete either as a zig-zag formation, or with Wave D carrying above Wave B (1729.86), to be then followed by Wave E. If this turns out to be the case, the SPX would then still have to complete Waves 3, 4, and 5 to the upside to complete the sequence from 1074.77.


So that would be the current long term count, which leaves us with the shorter term count. The SPX looks like it completed a 5 wave sequence from the 1729.86 high today. Wave 1 completed at 1720.20, and was followed by an inverted corrective wave to 1703.85. The move lower to 1674.99 then completed the third wave. After bouncing up to 1695.55 for the fourth wave, the move today to 1655.03 would complete the sequence.

A lot of information I know. For now, I believe a 5 wave sequence from 1729.86 has completed, or is about to complete. An initial target for this next move higher would be 1700, with resistance at 1668, and then 1685. I would like to see a move above 1668 to confirm the low is in place, and if the 1651 support level does not hold, I would need to re-evaluate the count.

Saturday, September 21, 2013

Weekend Outlook 09/21/2013

It was another interesting week for the markets, as all eyes were on the FED. Monday opened with the SPX gapping higher, up to 1703.74. The index then traded sideways up until the announcement Wednesday afternoon. Immediately following the announcement the SPX ran up to 1729 on Wednesday, and followed it up with a slightly higher high on Thursday at 1729.86. It was all downhill after that, as the SPX relinquished most of its gains by the close on Friday, dropping back to 1709.


As I mentioned last week, the SPX has now entered the range to complete 5 wave sequence from the 1627.47 August low. However, there are some indications that the market will make at least one more move higher before it actually completes that sequence.

I have been looking at a target of 1776 to complete a sequence from the October 2011 low of 1074.77. By my count the SPX is now in the third wave of a sequence from 1560.33 that will eventually complete that sequence. The first wave of this sequence completed at 1709.24, and the second at 1627.47. From that low, my count has four waves completed as 1641.18-1640.62-1664.83-1681.96. The fifth wave of this sequence has been difficult to follow on a short term basis, but a look at the longer term count can possibly clarify things to some extent.

Since the minimum target to complete the longer term wave from 1074.77 is 1776, the shorter term waves would also need to project into the same area. If the third wave completed at 1729.86, and this pullback has already carried down to 1708.89, the maximum target for wave 5 would be 1765, short of the 1776 target. For this reason, I would still expect another move higher, perhaps to 1745, before this wave ends. A move to 1745, followed by a pullback to around 1700, still seems to be the most likely scenario.

There a two possible short term counts for this wave which would project into the 1776 range.  The first is my original count, with 1703.74 being wave 1 of wave 5 from 1627. This would allow for the SPX to move slightly lower and still project to 1745. The second involves wave 1 ending before 1703.74, which was then followed by a complex inverted corrective wave. This scenario does fit better from the technical side. The complex corrective wave would have to have ended at Friday’s 1708.89 low, so if the SPX moves lower on Monday, this scenario would be out the window.

It still appears most likely, from my analysis that the SPX should move higher, possibly to 1745, and then be followed by a pullback to near 1700. One final move higher to above 1776 would then complete the entire sequence from the 1074.77 low.


Wednesday, September 18, 2013

Wednesday's Market 09/18/2013

The SPX opened slightly higher, and continued slightly higher into mid-morning. At that point it turned slightly lower, dropping below yesterday’s late afternoon low, and nullifying my very short term count. The index continued moving lower until mid-day, when it started moving higher in anticipation of the FOMC statement. After the release of the statement, the SPX moved sharply higher, making a new all-time high, and reaching 1729. After that, the index moved lower into the close.


As I mentioned, the move lower this morning made my very short term count from 1681.96 incorrect. I still see this as a wave 5 from the 1627 low, which has now moved above the minimum target level. It would appear that this wave has not yet completed, and I continue to look at the 1745 optimal target level as a possibility. I would expect the current wave to end before reaching 1776. Should the market move above that level, the possibility exists that the entire wave from 1074.77 is completing.

Tuesday, September 17, 2013

Tuesday's Market 09/17/2013

Having completed a semi-inverted corrective wave from Monday’s explosive opening late yesterday afternoon, the SPX was poised to move higher this morning, and it did. Today’s open was more muted than yesterday’s, but the index moved steadily higher, moving up to 1704. After a small pullback the SPX advanced again, this time to 1705.24. Another pullback was followed by a third move higher, with the index reaching the high of the day at 1705.52. This completed a 5 wave sequence from yesterday’s late afternoon low. After that the index completed three waves down at 1704.03-1705.33-1703.63 before moving higher into the close.


It now appears like the semi-inverted corrective wave that completed yesterday was but the first wave of an inverted corrective wave that completed this afternoon at 1703.63. Interestingly, this is the same structure that started this entire rally from 1627. By my count, the SPX has now completed wave 2 of 5 from that 1627 low. It would appear that the index is in the final stages of this wave. My target remains at 1745, but that is my optimal target. The minimum target, given my interpretation of the wave structure, would be 1713. A fairly wide range to be sure, but that is usually the case with a wave structure such as this, with the impulse waves increasing in length. Sometimes the smaller degree waves can narrow the range, but with only two waves of wave 5 completed, that is not the case at the moment.

I have been looking for this wave to end near 1745, and then be followed by a move lower to around 1680. As I said, the exact end of the current wave is difficult to pinpoint, but this has been a rather extended advance, and the risks of a pullback are growing. It is important to note that the 1680 number should not be taken as a target, but as a guideline at the moment. It is just as likely to see a shorter pullback, and then a continuation of the advance into the 17733-1776 area. I am content to see how this plays out over the next couple of days, or through the completion of this wave.

I am looking for the current wave from 1627 to complete above 1713, with an optimum target of 1745. Support remains at 1685, 1669, and then 1661.


Monday, September 16, 2013

Monday's Market 09/16/2013

It was another gap up open for the SPX, as the index moved above 1700 for the first time since early August. After moving up to 1703.74 after the open, the SPX pulled back to 1698.77, and then made one more push higher to 1704.95. After that the index moved steadily lower, dropping to 1695.15 before moving a bit higher into the close.


It still appears that the SPX is in a wave 5 from the 1627 low, with a target of 1745. I see wave 4 having completed last Thursday at 1681.96. From that point, it looks like the index completed a sequence this morning at 1703.74, and then formed a complex corrective wave into the afternoon low of 1695.15. This looks to be waves 1, and 2 of this 5th wave.

Support remains at 1685, 1669, and then 1651.


Saturday, September 14, 2013

Weekend Outlook 09/14/2013

Last Friday, with the SPX at 1655, I targeted the 1680-1687 range as a possible battleground for the bulls and the bears. On Tuesday morning the index moved above 1680, and the remainder of the week was spent between 1678.29, and 1689.97. On Wednesday the SPX moved above 1687.18, the upper limit for my semi-inverted corrective wave scenario that would have targeted a move lower to below 1560. This means that it is most likely that the index will continue higher, likely taking out the 1709 all-time high.


This has been a trying week for bulls and bears alike, and it seems only fitting that the market should head into the weekend without a clear resolution. I am still looking for the market to move higher, but I would feel more confident if the SPX could clear this 1685 support zone with some authority. Nevertheless, the SPX has moved above what I consider a critical level, 1687, and the wave structure still supports a move higher.


From the 1627.47 low, the SPX completed a 5 wave sequence to 1641.18. From that point, it formed a semi-inverted corrective wave that terminated at 1628.05. It was at this point that I indicated the index was poised to make an extremely powerful move to the upside. This semi-inverted corrective wave turned out to be but the first wave of an extended inverted corrective wave that eventually completed at 1640.62. So from 1627.47 the SPX has completed a wave 1 at 1641.18, and a wave 2 at 1640.62. The next move higher was to 1664.83, and looks to be wave 3 from 1627. This was followed by another inverted corrective wave that completed wave 4 at 1681.96. This gives an optimal target of 1639 for wave 5, very close to my original 1645 target.

When the SPX moved off its 1560.33 low in late June, I set a target of 1776. This target came into question as the index pulled back off the 1709 high, and eventually found its way to 1627. In my post on 9/4/13, http://5wavemodel.blogspot.com/2013/09/wednesdays-market-09042013.html, I outlined a scenario where the SPX could still reach that target. This entails the index forming 5 waves from the 1560 low that would complete a sequence from 1074.77 at 1773. These waves would go something like 1709.24-1627.47-1745-1680-1773. Given the discussion above, this seems to be a likely scenario. This would not complete a sequence from the 666.79 low, so there should be at least one more move to the upside after that.

For the week ahead, I am looking for a continuation of the move higher from 1627, with a target of 1745. My current wave count requires the SPX do hold above 1682. A break of that level at this point and the index could correct further, with support at 1669, 1651, and then 1621.


Thursday, September 12, 2013

Thursday's Market 09/12/2013

The SPX opened slightly higher this morning, moving up to 1689.29 before pulling back. After falling to 1685.71, the index turned higher, reaching 1689.97. After that, the SPX spent the rest of the day working its way lower, falling to 1682.30, and then bouncing to 1687.39 before falling back to 1681.96 just before the close.


Today’s 1689.97 high appears to complete the sequence from the 1654.45 low. The possible inverted corrective wave 4 I mentioned yesterday seems to have been incorrect, with the SPX actually completing a smaller degree wave sequence from 1678.29 to today’s high. From 1627.47 the market has now completed a sequence to 1641.18, which I see as Wave 1, followed by a complex corrective Wave 2 which completed at 1640.62.

From there I had been counting 1664.83 as Wave 3, 1654.45 as Wave 4, with Wave 5 possibly completing above 1683. With a 5 wave sequence from 1654.45 having now completed, it is possible that the SPX has reached at least a short term high. However, the entire move from 1640.62, Wave 2 from 1627, until today’s low at 1681.96, looks technically like a single wave. This would fit the inverted corrective wave scenario I spoke of yesterday, or the move from 1640.62 to 1654.45, was of a lesser degree than the move from 1627 to 1641.18. At the moment this scenario seems more likely.

This is supported by the move from 1664.83 to today’s low counting as an inverted corrective wave of some degree. This would mean the SPX should move higher off today’s 1681.96 low. This wave could possibly carry to 1676.70, but would more likely move higher from the open.

If the SPX moves below 1676.70, it would be most likely that a top from 1627 has been put in at 1689.97, and a pullback would then be expected. I think it more likely that the SPX will continue higher from this point, with 1745 remaining a likely target.

Support is at 1685, 1669, and then 1651.


Wednesday, September 11, 2013

Wednesday's Market 09/11/2013

The SPX opened to the downside this morning, slipping to 1680.90 before bouncing back to 1683.29. Another dip took it to 1678.70, just above the 1678.29 Wave 4 low I had mentioned yesterday was a critical level to watch. From there the index moved steadily higher, topping at 1688.13. Another dip took the SPX down to 1685.09, before a final push higher into the close took the index to 1688.59.


Although on the surface this appeared to be a fairly typical trading day, it is noteworthy for several reasons. The SPX fell to 1678.70, but remained above the critical 1678.29 level, which means my current count has not been invalidated. The index also rose above 1687.18 May 22nd high. This means that the semi-inverted corrective wave, which would have indicated a move down to below 1560, is no longer applicable. This does not mean the market cannot go down, of course, simply that the given scenario no longer is possible. Lastly, the SPX did not enter the 1690-1697 range that would likely have completed both a 5 wave sequence from both 1654.45, and 1627.47.

Looking at the wave structure from 1683.77, which I see as Wave 3 from 1654.45, it now looks like the SPX has completed a complex corrective wave from that point, to today’s 1685.09 late afternoon low. This is unusual since Wave 2 was also a complex wave. Normally only wave 2 OR wave 4 is complex, but rarely both. If this is indeed the case, it has the effect of raising the upper limit for wave 5 to 1708. This would be above the upper limit of wave 5 from 1627 as I currently have it. If the wave from 1654 does complete above 1700, it would open the possibility that the wave from 1627 is also undergoing a complex wave 4, even though wave 2 was a complex wave. If so, the market could undergo a small correction, and then target Wave 5 from 1627 at 1745, the other target level I have been mentioning. This seems to fit quite nicely.

If this works out, the SPX should put in a near term top between 1700 and 1708, undergo a pullback that should hold above 1668, and then move up to 1745.

1678.29 remains a critical level, as a drop below that could mean the SPX has made a short term top. The probabilities now favor a move to new highs, with a target of 1745. That, of course, is not the same as saying that the market cannot go down. The SPX has now risen over 60 points from the 1627.47 low, and some short term indicators are now in overbought territory. Support is at 1685, 1669, and then 1651.

It would be nice to see new all-time highs, as that would increase even further the probability of an additional move higher, it looks like that confirmation signal may have to wait. At the moment I would look for at least a short term high from 1690 to 1708. Exactly where that top occurs may give further insight into the longer term outlook and wave structure.


Tuesday, September 10, 2013

Tuesday's Market 09/10/2013

The SPX gapped up again this morning, and barely looked back. After hitting 1681 shortly after the open, the index continued higher until it reached 1683.77. From there the SPX pulled back 5 points, and then worked its way back to the intra-day high, and then surpassed it at the close.


I have been outlining two scenarios lately, one which has the market moving to new highs, 1745, and the other which has the SPX resuming its downtrend to below 1560. I have stated that the 1680-1687 range would be the battleground, and today the index found itself within that range. A top in this area would point to a continuation down to below 1560, while a move above 1687 would indicate a move to new highs.

  I have been looking at two wave sequences, with the first being from the 1627.47 low. Wave 1 of this wave completed at 1641.18, and was followed by a complex corrective wave that completed at 1640.62. Wave 3 completed Friday at 1664.83, and Wave 4 at 1654.45. This gives a target for Wave 5 above 1683. The second is from the 1654.45 Wave 4 low. Wave 1 of this 5th wave completed at 1666.15. After a complex corrective Wave 2, this ended yesterday at 1670.01. At the moment it appears that the move above 1683 today only completed Wave 3 of this sequence. The pullback to 1678 then looks like Wave 4, but the SPX has yet to complete Wave 5.

The upper limit of the wave from 1627.47 is 1699, and I can now give a target range for Wave 5 of this sequence as 1690 to 1697. It now appears quite likely that the wave from 1627 will complete between 1690 and 1697, above 1687, and would indicate a move to new highs. I will be looking for a move above 1687 to confirm this scenario. If the SPX moves below 1678.29, the Wave 4 low, before moving above 1687, my short term count from that low is probably wrong, and the more bearish scenario would be in play.

A move above 1687 would indicate new highs, while a move below 1678, without moving above 1687 would most likely mean a move to below 1560.


Monday, September 9, 2013

Monday's Market 09/09/2013

The SPX gapped higher at the open, hitting 1663, and then 1666.15 after a small pullback. After reaching 1666, the index paused, dropping 4.5 points before resuming the move higher. The SPX rose steadily until late afternoon, rising to 1672.4, before spending the last part of the day trading sideways, between that high and 1670.01.


On Friday I said that it appeared the SPX had completed a 5 wave sequence at 1664.83, and another to the downside at 1654.45, indicating another move higher was likely. With today’s move higher, that seems to have been the correct interpretation. The move to 1666.15 this morning looks to be a wave 1, which was followed by an inverted corrective wave 2, which completed this afternoon at 1670.01. This would mean that SPX should make at least one more move higher.

By way of review, I have been looking at two possible scenarios for this wave. The first is that this is part of a complex correction from 1687 that would go something like 1687.18-1560.33-1709.24-1627.47-1685?-1540? This scenario would require the current wave to complete between 1680 and 1687. I erroneously stated on Friday that the SPX would need to drop further than Friday afternoon’s 1654.45 low for the current wave, as I have been counting it, to complete within that range. I apologize for that, as this wave from 1627.47, as currently constructed, could complete above 1683.

The second scenario has 1687.18 as a top, 1560.33 as a bottom, and a 5 wave sequence underway from that point that would go 1709.24-1627.47-1745-1680-1773. This had been the preferred sequence, as until Friday it looked as though the wave from1627 would complete above 1687. However, after I identified the inverted corrective wave on Friday, and the possibility of the SPX completing this wave between 1680 and 1687, both scenarios are at least equally likely, with perhaps a slight edge given to the first scenario.

There are a couple of reasons for this. First, there is a good possibility that this wave will complete within the 1680-1687 range. Second, if this wave does end there, the first support zone is setting up to be in the 1645 area. That would seem to be a pretty severe drop if the SPX were setting itself up for new highs. Also, many of the technicals are reaching overbought levels again.

As I said on Friday, the battleground is shaping up to be in the 1680-1687 range. If the SPX gets above 1687, I would be inclined to think that this market will continue higher. If the index gets into that 1683-1687 range, and then pulls back, it is likely that it is headed lower, most likely below 1560.

Shorter term, I am looking for the SPX to make one more move higher, to above 1683, and that should be followed by a pullback, as it would complete a sequence from 1627. Resistance is at 1685, with support at 1669, 1651, and then 1621.