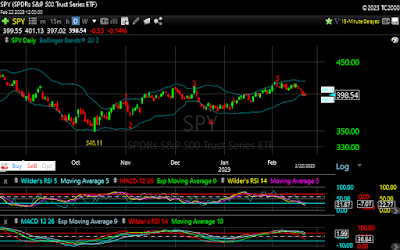
Given the oversold conditions the market closed at on Tuesday, it would not have been unexpected for the market to attempt a rally this morning. Initially it did, as the market opened slightly higher to just above the 400 level. That was short-lived however, as the market soon resumed it's downward trajectory, falling once again below the 400 level to 397.62. Another, more sustained rally took hold from there, and the market enjoyed a steady rise to near the 401 level ahead of the Fed Minutes. The market swung higher and lower immediately following the release of those minutes, before again deciding on a downward path. SPY once again tested the 397 level right before the close, before rallying to close at 398.60.
Yesterday I mentioned the shorter time frame charts being noisy. Today's action seemed to clarify some of that, and while still noisy in spots, some things have come into clearer focus. Counting from the recent 418.31 high, I am counting the initial move down to 407.57 as Wave 1 of this move lower. The market then moved in sideways fashion to 416.49 - 405.01 - 415.05, which can be counted as Waves A - B - C of an inverted corrective wave. After that, the entire move down to today's low of 397.02 can be counted as a 5 wave sequence for Wave D.
In the short-term this count implies a move higher. Given the structure of the inverted corrective wave to this point, the Wave E target would be between 407 - 412. From that point we may see another move down. My work still shows a downside target somewhere below 396. For now I'll leave it there and follow this a wave at a time.
If you find value in this analysis, please consider a donation to help us continue our research.


No comments:
Post a Comment