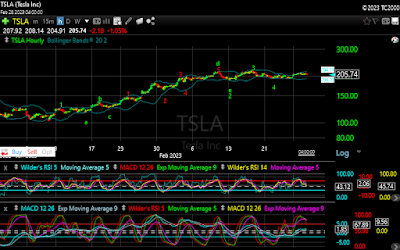
If you read Monday's Update, you had a pretty good roadmap for today's session. In that update I said I was expecting a move higher at the open, followed by a 6-8 point pullback. TSLA did open higher, gapping up and hitting a high of 211.23. It is notable that it stopped just shy of the 212 lower bound that would end the sequence from the 101.81 low. It is nice when a forecast comes to fruition, but obviously they will not all be that good. But the accuracy does speak to the forecasting power of my model. Some set-ups lend themselves to highly accurate forecasts, while others are more difficult. I thought I would walk through what I saw yesterday in the set-up, and how I was able to arrive at those forecasts.
This blog introduces a new way to analyze the stock market. The 5 Wave Model uses relationships between up and down movements, or waves, in the price action to determine turning points in the market.
Tuesday, February 28, 2023
TSLA Tuesday Update 02/28/2023
I will start with the final A-B-C-D sequence on the chart. The previous Wave 3 is our start point, so we have 197.67-194.00-208.22-204.22-209.42. Taken as points, that gives, (197.67, 194.00), (208.22, 204.22), (209.42, X), where X would be the Wave E completion point. The pullback at the end of yesterday's session had a low point of 206.35. Using that as X, the resulting linear regression gives an R^2 value of .9952, above the .99 threshold. This allowed me to consider that as the endpoint of the sequence.
The A-B-C-D-E sequence was then the end of Wave 4 of the 1-2-3 sequence started on the 24th. So we have (192.80, 195.67), (193.58, 197.67), (206.35, X). The minimum value for X that gives an R^2 value above .99 for that regression is 208.02. This gave a me a minimum value for today's opening move up. The high of that move, 211.23 gives an R^2 value of .9955.
That opening move to 211.23 thus completed the 5 wave sequence from Wave C on the 24th, or Wave D. Given the four completed waves, the sequence is (205.14, 196.33), (203.28, 192.80), (211.23. X). Being able to infer today's opening move allowed be to extrapolate that into the 6-8 point pullback, since it would be completing the inverted corrective wave starting with Wave 1 on the 23rd. The pullback to 203.75 was just under 8 points, and gave the sequence an R^2 value of .99086.
The final count after that is shown here:
Looking at today's action, we had the opening rise to 211.23, followed by a pullback to 203.75. That sequence looked like, (211.23,206.43), (208.43, 204.71), (206.19, 203.75), with an R^2 value of .99038. From there the market moved higher again, tracing out a five wave sequence as (203.75, 206.33), (204.86, 207.88), (206.31, 209.41), with an R^2 value of .99357. After that TSLA moved lower, dipping to 204.91, before trying to rally into the close.
In my current count from the 101.81 low, TSLA has now completed four waves of a five wave sequence, with Wave 4 completing at 191.78. Today's low would be the completion of Wave 2 from that Wave 4 low. With four waves completed, we can project Wave 5 to complete between 212, and 234. That remains my current target. Some of my work shows a convergence around 229, but any move between 212, and 234 would be sufficient to complete the sequence. The 191.78 Wave 4 low would be a critical point. A move below that would require a revision to the current count.
Subscribe to:
Post Comments (Atom)


No comments:
Post a Comment