Thursday, October 17, 2013

Thursday's Market 10/17/2013

The SPX opened to the downside this morning, falling to 1714.12. It appears I was a bit premature yesterday in calling for the completion of an inverted corrective wave at 1715.19. I would now say that 1715 was only wave C of that wave, with the bounce to 1722 being Wave D. The lower opening today would then be Wave E, and completed the inverted corrective wave 2 from Tuesday’s 1695.93 low. After the opening drop, the SPX rallied, moving to 1729.64. This looks to complete Wave 3, and was then followed by a drop to 1725.96 that would seem to complete Wave 4. The index rallied once again off that low, rising to a new all-time high of 1733.45 before fading into the close.


With 4 waves seemingly completed from the 1695.93 low, all that is left now is the completion of wave 5. This wave should complete above 1741, with an optimal target of 1746. This is very close to my ongoing target of 1745 for the completion f the wave from 1646.47. Yesterday I said I was leaning towards an alternate count for that wave, which now seems to 
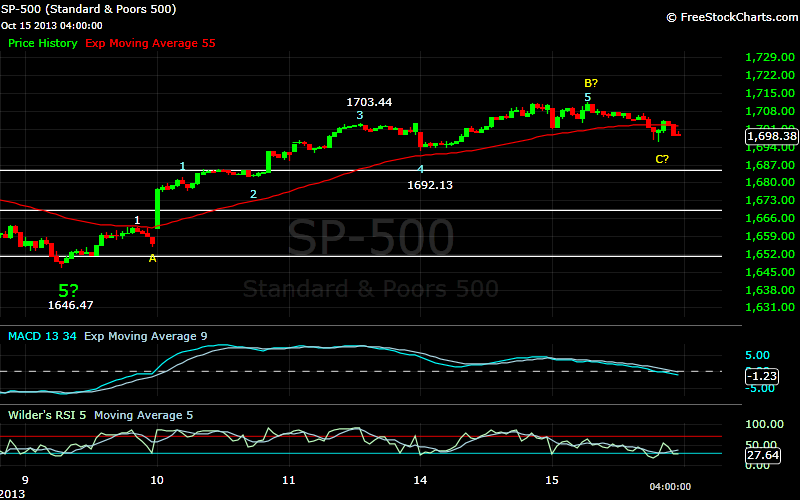
be playing out. It is possible that 3 waves completed at 1662.47, as opposed to the single wave I had been counting. These 3 waves may have completed as 1646.47-1654.69-1651.02-1662.47. This was followed by an inverted corrective wave 4, which went 1654.81-1703.44-1692.13-1711.57-1695.93. This count yields an optimal target of 1745. Thus it appears quite likely that the sequence from 1646.47 will complete between 1741 and 1752, with 1745-1746 being the optimal target.


If this wave does complete within that range, I would then expect the SPX to move lower. As a rough estimate, I would be looking for a low near 1680. This fits well with my longer term count from 1074.77. I still do not see this as the end of this longer term sequence, but a continuation of the converging upward trend that has been in place since the 1560.33 low.

Support remains at 1723, and then 1703. A move below 1714 at this point could signal the end of this move.


Wednesday, October 16, 2013

Wednesday's Market 10/16/2013

The SPX opened higher this morning, jumping above 1710, and then continuing higher until it reached 1721.75. After that the index worked lower into the afternoon, falling to 1715.19 before rising near the high of the day towards the close.


The higher opening this morning supports the alternate count I discussed yesterday that an inverted corrective wave completed yesterday at 1695.93. The late afternoon rise to 1704.46 then completed a wave 1, with the pullback becoming wave A of an inverted corrective wave. Wave B of this wave completed at today’s high of 1721.75, very close to the 1723 resistance level I have been mentioning. The meandering pullback into the afternoon completed waves C, D, and E, and thus wave 2 from yesterday’s 1695.93 low. This means the SPX should now complete waves 3, 4, and 5 to the upside.


Looking at the count from the 1646.47 low, it does look like an inverted corrective wave completed from 1662.47 to 1695.93. I have added this count to the chart, which is denoted by the use of parentheses. This count continues to point to higher prices, and my target remains 1745. 1723 would be the last resistance level suggested by the previous wave structure, and if that level is cleared the SPX should be headed to new highs. Support is at 1703, and then 1685.

While it is difficult to pinpoint the exact high of this move at the moment, I have been looking for it to be above the previous high of 1729.86, with an optimal target of 1745. 

Tuesday, October 15, 2013

Tuesday's Market 10/15/2013

The SPX started the day to the downside, continuing the pullback from yesterday’s 1711.03 high.  After dropping to 1701.03, the index started to move higher, and made the high of the day at 1711.57. This was slightly above yesterday’s high, and right at the 1711-1713 level I pointed to in yesterday’s post as a possible high. This did not happen exactly as I thought, but the level turned out to be correct none the less. From there the SPX started to sell off, dropping back below 1700 to 1695.93 an hour before the close. The last hour saw the SPX rise to 1704.46 before settling back to 1698.06.


Continuing the count from last Wednesday’s low of 1646.47, today’s high would appear to be wave B of an inverted corrective wave, followed by wave C at 1695.93. If the move to 1704.46 was wave D, wave E would project to 1690. If D has not ended, the market should be higher from here before starting wave E down.

Considering today’s nearly 16 point drop from 1711.57 to 1695.93, another count has presented itself. The three largest pullbacks since 1646.47 have been 1662.47-1654.81, or slightly less than 8 points, 1703.44-1692.13, or 11 points, and 1711.57-1695.93, or 16 points. This may have completed an inverted corrective wave, and would point to a target of 1745.

I continue to see this market moving higher, with a target for this wave of 1745. Considering everything that is going on in Washington at the moment it is difficult to have absolute conviction on anything, but my wave count points to higher prices. There may be a continuation of the pullback before the index moves higher, but I would expect this to remain above 1685. A move below this level would mean my current assumptions are wrong.

Resistance is at 1703, and then 1723, with support at 1685, and then 1669.