Sunday, May 4, 2014

Weekend Outlook 05/04/2014

The SPX entered Monday trying to halt the sell-off from the previous week.  At the outset it looked as if it was going to do just that, staging an early morning rally to 1877. The rally ended there, with the SPX moving to a new short term low at 1850.61. That also marked the low for the week, as the index rallied sharply from that point, making it all the way back to 1873 near Monday’s close. The rally continued into Tuesday, with the SPX moving up to 1880.60. After a small pullback to 1872.69, the index drifted mostly higher through the week, topping out at 1891.33 on Friday.


From Monday’s 1850.61 low, it appears the SPX completed a simple 5 wave sequence as 1880.60-1872.69-1888.59-1879.96-1891.33. The completion of this sequence at 1891.33 opens the possibility for several longer term counts, which I will try to expand upon one by one.


I will start with the count I have been carrying for some time. This count has the SPX completing the first three waves of a 5 
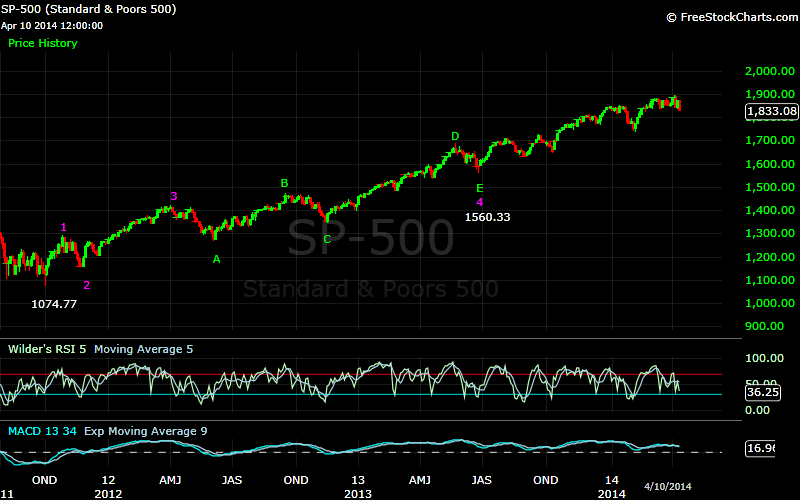
wave sequence from the October 2011 1074.77 low as 1292.66-1158.66-1422.38. The fourth wave of this sequence was an inverted corrective wave that completed as 1266.74-1474.51-1343.35-1687.18-1560.33. Since 1560.33 I have been waiting for a 5 wave sequence to complete, which would complete the entire sequence from 1074.77

From 1560.33, the SPX completed the first wave at 1709.36. Wave 2 was an inverted corrective wave that played out as 1639.43-1669.51-1627.47-1729.86-1646.47. A sequence then completed at 1850.84, and was followed by a sequence down to 1737.92. These may have been waves 3, and 4 from 1560.33, and would project a minimum target for Wave 5 of 1957, with an optimal target of 2001. In this scenario Wave 1 of 5 completed at 1882.35, and was followed by three waves down, which would likely be Waves A, B, and C of an inverted corrective wave. If the SPX holds above the recent 1850.61 low, this would be the most likely scenario, but cannot be ruled out unless the index falls below 1814.36. This count has held up pretty reliably for some time, and given the nature of this market I would be reluctant to discard it unless there is more confirmation to the contrary.

The second count is the same as the above until the SPX reaches 1850.84. The move from 1850.84 to 1814.36, 1737.92-1882.35-1837.49-1872.53-1814.36, can be counted as an inverted corrective wave. This would make 1850.84 only Wave 1 of 3 of 5 from 1560.33, and the move to 1814.36 Wave 2 of 3. It is then possible that Wave 3 from 1560.33 completed this week as 1850.84-1814.36-1884.89-1850.61-1891.33. This would mean the index would need to complete Wave 4 to the downside and Wave 5 to the upside before completing the sequence from 1560.33, and from 1074.77. The target for Wave 4 would be first 1849, and then 1775. Wave 5 would then be longer than Wave 3, which was about 245 points.  Whereas the first scenario I outlined would indicate higher prices from current levels, the second would indicate a further pullback before prices advance again.

The third scenario requires a slightly different count from the 1074.77. In this count 1292.66 as Wave 1, but then has 1158.66 as Wave A of an inverted corrective wave. 1422.38 would then be Wave 1 of B, which was followed by the same inverted corrective wave as discussed previously as 1266.74-1474.51-1343.35-1687.18-1560.33 to complete Wave 2 of B. Waves 3, 4, and 5 then completed as 1709.67-1627.47-1729.86. This would have completed Wave B from 1292.66, with Waves C, D, and E completing as 1646.47-1850.84-1814.36, and thus completing Wave 2 from 1074.77. Waves 3, 4, and 5 would then have completed as 1884.89-1850.61-1891.33. This would mean that the sequence from 1074.77 completed on Friday at 1891.33. Again, I would be looking for some confirmation before becoming convinced of this scenario.

Given these three scenarios, it is likely that the SPX will continue higher, possibly to at least 1957, although this pullback may continue a little longer. 1850 seems like an important level to watch.

Thursday, May 1, 2014

Thursday's Market 05/01/2014

For some time now I have been tracking a 5 wave sequence from the June 24th low of 1560.33 on the SPX. I have been looking for the end of this sequence to complete a larger 5 wave sequence from the October 4th 2011 low of 1074.77. The sequence from 1560.33 began with Wave 1 to 1709.36, and was followed by an inverted corrective Wave 2 which completed at 1646.47. After that the SPX completed a 5 wave sequence higher to 1850.84, which I had originally counted as Wave 3 from 1560.33. This was followed by a sequence lower to 1737.92. Another sequence completed to the upside at 1882.35. From this point the SPX became quite choppy, and by my count 3 waves into the 1814.36 low as 1837.49-1872.53-1814.36. These 5 waves from the 1850.84 high, 1737.92-1882.35-1837.49-1872.53-1814.36, count as an inverted corrective wave. Since Wave 2 from 1560.33 was an inverted corrective wave and normally only one corrective wave in a sequence is complex as Wave 2 was, it is best to count 1850.84 as Wave 1 of 3 from 1560.33, and the subsequent inverted corrective wave as Wave 2 of 3.


This count suggests that the SPX should form 3 waves higher from 1814.36 to complete Wave 3 from 1560.33. This would then be followed by a corrective Wave 4, and then one final move higher to complete the sequence from 1560.33, and also a sequence from 1074.77. Looking at the relationship between Wave 1, and Wave 3 so far, Wave 5 would be expected to be longer than Wave 3, indicating that the SPX would move much higher than current levels.

So again, I am looking for 3 waves higher from 1814.36 to complete this Wave 3. Looking at the action from that low, 3 waves can be counted as 1884.89-1850.61-1888.59, which was today’s high. The count of 1850.84-1814.36-1884.89-1850.61-1888.59 satisfies the parameters for a completed sequence from 1814.36. A move below 1850.61 would most likely confirm this count, and signal the end of Wave 3 from 1560.33. It is also possible at the moment that the 1884.89-1850.61-1888.59 move is only the first 3 waves of Wave 3 of 3 of 5. A move above 1888.59, without violating the 1850.61 low, would increase the likelihood of this scenario.

As I mentioned above, this would require one more move higher for the SPX, a move that should exceed the 242 point length of Wave 3. I am still not completely sold on the idea of another 250 +/- move on the SPX, and there is another count that suggests that today may have marked the completion of a larger degree wave. This count would indicate that the SPX may be near, or may even have completed, the sequence from 1074.77.


This is a count I spoke of back in October (http://5wavemodel.blogspot.com/2013/10/mondays-market-10142013.html). Whereas the count above counts the first three waves from 1074.77 as Wave 1(1292.66), Wave 2(1158.66), Wave 3(1422.38), followed by an inverted corrective Wave 4 which completed at 1560.33, this alternate count is slightly different. This has 1292.66 as Wave 1, 1158.66 as Wave A of 2, and 1422.38 as Wave 1 of B of 2. The next 5 waves are the same in each case, with 1266.74-1474.51-1343.35-1687.18-1560.33 completing an inverted corrective wave, only of differing degrees. In this alternate count, this is Wave 2 of B of 2. Waves 3, 4, and 5 completed as 1709.67-1627.47-1729.86, and completed Wave B of 2. 1646.47-1850.84-1814.36 then completed Waves C, D, and E, and Wave 2 from 1074.77. Just as in the first scenario the SPX now needs to complete 3 waves higher from 1814.36, but this time those three waves will complete a sequence from 1074.77.

The three waves I outlined in the first example, 1884.89-1850.61-1888.59, also satisfy the parameters for the completion of this wave. The same caveats apply to this scenario as they do in the first.

The only difference between these two scenarios is the move from 1709.36 to 1627.47 following the initial rise from 1560.33. I had originally counted this as a single 5 wave sequence, and later changed it to three separate waves, 1639.43-1669.51-1627.47. This move was quite choppy, which made it difficult to track with complete certainty. If my original count was correct, and it was a single move, the alternate scenario of this being the completion of the wave from 1074.77 is the most probable. If it is three waves, the first scenario is the most probable. In either case, I would expect a move lower to begin soon, with the main difference being the degree of that move lower. 

Friday, April 11, 2014

Thursday's Market 04/10/2014

The SPX started slightly to the downside, dropping to 1868.46 before rallying to 1872.53. This was just above yesterday’s 1872.43 high, and completed a 5 wave sequence from 1837.49. It was not surprising that the sequence completed just above yesterday’s high considering the extent of yesterday’s run-up, and the extreme overbought conditions it created. A pullback at some point was expected, however the extent and speed of it was. Once the sell-off started, it continued nearly unabated to 1840.03. From there the first semblance of a rally appeared, and the index moved up to 1847.55. Another wave of selling took the SPX down to 1830.87 before another rally moved the index to 1839.12. The SPX then sold off into the close, dropping to 1833.42.


When the SPX fell to 1837.49 last Tuesday, it appeared the correction from 1882.35 was finally over.  While that may still be the case, today’s action keeps open a couple of scenarios that seemed to have been relegated to back up status.

I will try to take this one step at a time, so I will start from the current move from today’s 1872.53 high. The SPX completed a 5 wave sequence to the downside at 1840.03. From there the index rallied just less than 8 points, fell to 1830.87, and then staged a rally of just over 8 points. If the SPX opens lower, it would complete a 5 wave sequence at 1828. If the index opens to the upside, it would complete an inverted corrective wave at 1841. This sets up my first support, and resistance levels. The first scenario could mean an end to the current decline; the second would indicate further downside ahead.

Moving out to my current view that the SPX is currently in a wave 5 from the June 1560.33 low, Wave 1 of 5 would have completed at 1882.35. It is now apparent that the sequence to 1837.49 was not the end of the decline from 1882.35, but could be the beginning of an inverted corrective wave with the decline to 1837.49 as a wave A, the rally to 1872.53 a wave B, with wave C currently underway. Support for this scenario would be 1827, and then 1803. This scenario would result in higher prices, with the minimum target being 1957 as I have mentioned.

The second possibility is that the SPX is still in an inverted corrective wave from 1709.36. This has been my alternate scenario, and would target 1758.