Friday, July 20, 2012

Thursday's Market 07/19/12

The market gapped up at the open, and continued to a new uptrend high at 1378.23 in the first few minutes of trading. The market then turned lower, giving up all of the early gains, and then some, as the SPX dropped to 1371.21. Another rally followed the pullback, and the market soon found itself once again in new uptrend high territory. This time the SPX made it to 1380.39, before pulling back again. The market again dropped near the 1372 level, and then staged a choppy rally back near 1378 into the close.

The early morning run up, and subsequent drop, appears to have been part of a semi-inverted corrective wave from Wednesday afternoon’s high. The following move to 1380 completed a 5 wave sequence from 1368.70, and wave 3 from 1325.41. We may have seen wave 4 with the pullback to 1372. If so, the market should be in wave 5, which could complete a 5 wave sequence from 1267.

In Wednesday’s Medium Term Update, I outlined a scenario for a 5 wave sequence from 1267 being close to completion. The current target for that wave would be between 1383, and 1397. If my current count is correct, I can narrow that forecast to between 1383 and 1384.
I will say again that the wave structure lately has been very complex, and there is a scenario in which this would complete wave 3 from 1267, and not wave 5. The projections for each are similar, with the wave 3 scenario most likely terminating between 1390 and 1391. This should clear up shortly, but as stated, the projected highs for each scenario are similar.
If the market moves up to 1383-1384, and then drops below 1372.33, it is most likely that a 5 wave sequence from 1267 has completed. Support is at 1367, 1357, and 1333-1336. Resistance is at 1383-1384, 1390-1391, and 1426.


Wednesday, July 18, 2012

Medium Term Update 07/18/12

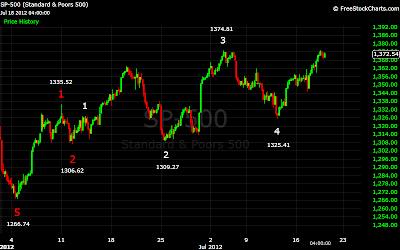
Up until this point I have kept my current count from the 1266.74 low intact, even though I have had some reservations about it, which I have expressed from time to time. The main problem with this count has been the increasingly higher projections it has been giving with each completed wave. I have kept this count because I better one has not presented itself until now. At this time I feel a better option, or at least an equally good one, has appeared.

 I’ll start by reviewing my current count from 1267. This begins with the completion of a 5 wave sequence from that low at 1335.52. This is wave 1 in red on the accompanying chart. A corrective sequence to 1306.62 has been labeled wave 2 in red. A five wave sequence to 1327.28 completed wave 1 of a smaller degree, which is labeled in white. Wave 2 of this sequence I had labeled as a semi-inverted corrective wave, which terminated at 1309.27. Five separate 5 wave sequences then completed white wave 3, and another 5 waves down completed wave 4. That would have the market currently in white wave 5, which would complete wave 3 in red, of a 5 wave sequence from 1267.
The main issue I have had with this entire sequence from 1267 is the move from 1306.62, labeled wave 2 in red, and 1309.27, which is labeled wave 2 in white. From 1306, I have white wave 1, followed by wave 1 if the semi-inverted corrective wave in green, followed by waves 1 through 5 in yellow, which completed wave 2 in green of the semi-inverted corrective wave. This is followed by waves 3, 4, and 5 of the semi-inverted corrective wave in green, which terminates at wave 2 in white, or 1309.27.

While this count satisfies my model, it seems a bit convoluted. By simply using waves 1 through 5 in yellow from 1306.62, my model is also satisfied. I have refrained from using this count because the move from 1306.62 to yellow wave 1 doesn’t break down easily into a 5 wave sequence. However, this appears to be the simpler, and at the moment, better solution.

I’ve labeled this possibility as A-B-C-D-E on the chart for clarity. The move down from 1363.46 to 1309.27 is also interesting. A clear 5 wave sequence formed to 1324.41, and after a short rebound the market dropped to 1309.27. This entire wave breaks down into a 5 wave sequence the best, but for this discussion, I’ll also assume that it breaks down into two separate 5 wave sequences.
On the next chart I have replaced all the numbers with X’s to mark the 5 wave sequences I have identified.

And on this chart, I show the possible new count. This count would put the market in wave 5 from 1267, which projects to 1393.


Wednesday's Market 07/18/2012

After opening slightly higher, the market moved down to 1358.96. From that point the market staged a pretty powerful rally, moving above the previous uptrend high of 1374.81, making it to 1375.26. The market then pulled back, dropping to 1368.70, before rallying back to 1373.77. After pulling back slightly, the market moved higher into the close.

Yesterday I mentioned the possibility of a complex corrective wave forming, and it appears that is what has played out the last two days. After rallying off the 1325.41 low, the SPX completed a 5 wave sequence for wave 1 at 1361.32. From there, an inverted corrective wave formed, first taking the SPX down to 1345.07, before the strong rally to 1375.26. 1345.07 marked the end of wave 1 of the corrective wave, with the move to 1375.26 creating a series of 5 wave sequences of ever diminishing length. This completed wave 2. Waves 3, 4, and 5 took the market to 1368.70, which completed the corrective sequence, and wave 2 from 1325.41.

  I would expect the market to continue higher from here. I would now expect waves 3, 4, and 5 to complete at, or near 1393. While I have been looking at 1393 to complete wave 3 from the 1267, there is a count developing that would complete a 5 wave sequence from that point. I hope to elaborate on this later tonight. Either way, 1393 looks like an important point. What happens from there could determine the longer term direction of the market. While I think the market may correct from that level, I do not see a move back down to 1267.
Resistance is at 1387-1397, and then 1426. Support is at 1367, 1357-1358, 1337, and 1323-1326.