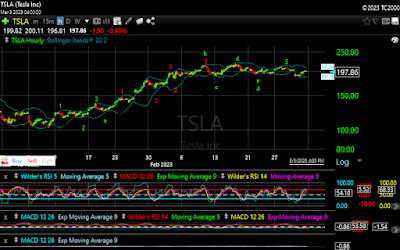
In Tuesday's Update, my analysis was that TSLA had completed 5 waves of a 5 wave sequence from 101.81, and set a target between 212-234. I gave 191.78 as a point at which that analysis would be invalidated. Wednesday saw TSLA move lower from the opening, falling to a low of 198.52. During the afternoon TSLA moved mostly sideways, with a slight upward bias, rising to 203.42, before closing at 202.75. Technically TSLA hit oversold at the open on the 15 minute chart, and the sideways move into the close worked off that oversold condition, and worked into overbought territory, setting up a lower low, lower high situation going into Thursday.
Given that set-up, TSLA gapped down on Thursday, dropping to 186.01, and moving below the critical 191.78 level necessitating a revision to my analysis. Once again TSLA moved mostly sideways the remainder of the day, rallying slightly off the low, and then falling again into the afternoon. This action created a short term buy signal at 3:45 on my technical charts, with TSLA at 191.07.
TSLA gapped up on Friday, opening at 194.61, and continuing to rise through most of the day. My short term technical signals gave a cover at 199.13. TSLA topped at 200.48, before giving back a little ground into the close.
With TSLA moving below the 191.78 level, we will need to review our analysis. I will begin where I left off on Tuesday.
Here is my count from Tuesday. As you can see, I had TSLA in Wave 3 of Wave 5 from 101.81, with a target of 212-234. Obviously this was wrong. One thing I had noticed on Tuesday, but had discounted, was the initial move off the Wave 4(Green) low on the 22nd. If that initial move were Waves 1,2, and 3, instead of Wave 1, the wave from Wave 2, the move following the low marked Wave 2(Red) on the 28th to the upper Bollinger Band would complete a 5 wave sequence from that Wave 4 low. This would look like 191.78 - 201.99 - 196.82 - 205.14 - 203.75 - 209.41. Taking those as points, and applying a linear regression, we get (191.78, 201.99), (196.82, 205.14), (203.75, 209.41), with an R^2 value of .99998. The move from Wave 4 would now look like this:

As you can now see, TSLA completed a 5 wave sequence from the 191.78 Wave 4 low. I had originally discounted this for two reasons. The first being that it would require a wave 5 failure, as it would not complete at the high, which is rare, and the second being that it did not meet the requirements for Wave 5. So now we must re-evaluate the count from the 101.81 low.

This had been my count going into Wednesday. For the sake of clarity I removed the smaller waves from Wave 4, and marked the end of the 5 wave sequence from that point with "X". The initial move is notated by Wave 1. Following the green A-B-C-D-E, will lead you through what I had counted a an inverted corrective Wave 2. This took the form (123.52. 115.60), (136.68, 124.31), (214.00, 187.61), with an R^2 value of .9943. Normally the first instance of sequence exceeding the R^2>.99 threshold denotes the end of a sequence. However, that is not always the case. If one looks at the sequence B-C-D-E-3-4, one would notice that this also forms a sequence with an R^2 value over .99. Namely (136.68, 124.31), (214.00, 187.61), (217.65, 191.78), with an R^2 value of .99978. Changing A and C to 2 and 3 respectively, and following that with an inverted corrective Wave 4, results in this chart:

Now we can evaluate the sequence 1-2-3-4-X from 101.81. With Wave X terminating at 209.41, we have (101.81, 123.52), (115.60, 136.68), (191.78, 209.41) with an R^2 value of 1. Thus we have a 5 wave sequence from 101.81 completing at 209.41.
The decline from the 209.41 high formed a 5 wave sequence down to the subsequent 186.01 low as is seen here:
One method of creating a target range for a corrective wave is to look at a relationship between the origin of the previous wave, the subsequent corrective low, and two highs from the previous wave, normally the last two highs, as depicted here:
Using this method gives a range between 178-188 for the correction from the 209.41 high. Thursday's 186.01 low falls right into that range. While still too early to call that a low, it is quite possible.
Technically, TSLA is close to giving a buy signal on the 15 minute chart, but has not as of yet. On the 60 minute chart the stock has reached overbought, and on the Daily chart it is oversold, and close to giving a buy signal. The action over the next few days should give us some insight into short and longer term direction.


No comments:
Post a Comment