Friday, June 29, 2012

Friday's Market 06/29/12

On Thursday, after a steep decline to start the day, the SPX hit the 1313 support, and then started to rally. The previous 5 wave sequence from 1334 broke down into 5 sub-waves, with the impulsive waves diminishing in length. This usually signals an impulsive move in the opposite direction is imminent. The initial move of this rally took the market to 1318.71, which surpassed the previous wave 4 high of 1317.54. This normally confirms the change in trend. The SPX then rallied into the close, nearly reaching 1330.

The rally continued at the open on Friday, with the SPX opening significantly higher. This gap opening was part of an inverted corrective wave 2 from Thursday’s 1313 low. The market continued higher, nearly reaching 1356, and then traded in a narrow up-sloping trading range until hitting 1358.41, right at the 1358 resistance line. After dropping a couple of points to 1356, the SPX moved higher into the close, topping at 1361.63.

Although I had remained bullish as the market was on the verge of breaking down, I have mentioned that the short term waves were a bit confusing. Much of that confusion cleared up today when the SPX hit 1361.63. The market has now formed a clear 5 wave sequence from 1309 to today’s 1362 high. I believe this completes wave 3 from 1307. The fact that the market did not take out the previous high of 1363 is not troublesome, in my view, due to it being part of an inverted corrective wave.

Even though the recent market action was cleared up with Friday’s move, the entire move from 1267 still leaves us with several resolutions. I continue to see this as wave 3 from that level, with wave 3 of 3 completing today. My target for wave 3 has been 1393, and that is still a possibility. However, given the current wave structure, the SPX would have to undergo another rather lengthy correction, back down near 1313, which seems unlikely, for that scenario to play out. Last weekend, I mentioned a secondary target for wave 3 of near 1475. This scenario would require a much smaller correction, which seems more reasonable. The maximum length of this corrective wave would bring the market back down to near 1335. This correction could be much smaller, but given the diminishing impulsive wave lengths from the recent 1313 low, a break below wave 4, at 1356, could trigger a larger correction, with support being near 1345.
One other possibility assumes that my counts to this point have not been correct. The SPX is in a zone that would complete a 5 wave sequence from 1267, and probably mark the end of this entire uptrend. This would require the move from 1306.62 to 1363.46 to be counted as a 5 wave sequence, something that I do not see. It is a possibility, so it deserves a mention. The current move to 1362 would be wave 5 of this sequence. A move above 1365 would nullify this scenario.
I will go into all of this in more detail over the weekend.


Thursday, June 28, 2012

Thursday's Market 06/28/2012

It was another very interesting day for the market. It opened sharply lower, moving below the 1326-1323 support level, and then bouncing back into that zone. The support did not hold, as the market continued down, hitting the 1315 support. After another small bounce, the market hit the low of the day at the 1313 support level. At that point, things got really interesting. The market moved sharply higher, gaining back almost all of the earlier losses.

The short term counts are still a little confusing. At the moment it appears the SPX completed a 5 wave sequence from 1309 at 1320. After a small corrective wave, the market completed another 5 wave sequence of one smaller degree at 1334. Today’s drop was wave 2 of that sequence, with wave 3 currently underway.

Short term resistance should be at 1340-1345, 1350, and 1372. Support remains at 1326-1323, and the 1315-1313.
Longer term, my best count from 1267 remains wave 3 of 3, with a target of 1393.


Wednesday, June 27, 2012

Wednesday's Market 06/27/12

The market opened higher today, quickly moving above the 1323-1326 resistance level to 1327.54. The market then pulled back into that resistance zone to 1323, before moving higher once again. A strong rally off 1323 brought the SPX to almost 1332, and then dropped to 1323. Another rally took the SPX above 1333 and after one more pullback to 1329, rallied to the high of the day at 1334.40. A dip into the close took the market to 1331, before moving higher just before the close.

Yesterday I outlined two scenarios for the market. The first had the SPX completing wave 2 from 1307 Monday at 1309.27. I saw 3, and possibly 4, waves having been completed from 1309, with wave 5 projected to terminate at 1341. The second scenario assumed that 1363 completed a 5 wave sequence from 1267, and the market was headed lower. The most likely count from 1363 would be an inverted corrective wave 2, with an upper limit of about 1329. Today, when the market moved above that level, that count was eliminated, and the first scenario continues to be the most likely in my view.


It appears 4 waves have completed from 1309, wave 1 at 1320, and wave 3 at 1324. Wave 4 completed Wednesday at 1319.62, along with waves 1, and 2 of 5. Today we saw wave 3 at the open, then an inverted corrective wave 4, which terminated at 1328.86. So far, it appears 4 waves have completed from 1328.86. So now I am looking for wave 5, of 5, of 5 from Monday’s 1309 low. I am raising my projection for that wave to 1349, from 1341. This should complete wave 3 from the 1310.51 low.
 
There is one bearish scenario that suggests a 5 wave sequence being completed at today’s 1334 high. Should the market break below 1328 before making a new high, this count may be in play, and the market could see a sharp decline.

Short term support remains at 1326-1323, and then 1315-1313.


Tuesday, June 26, 2012

Tuesday's Market 06/26/12

The market opened higher today, continuing the rally from Monday. The SPX hit 1320 within the first fifteen minutes, and then started to sell-off. First, the market fell back to the 1315-1313 support area. After trying to bounce off 1313, the market broke below that support, falling back to 1310. The market found some buyers at that point, breaking back above 1315. From there, the market rallied again, making it back to 1320, and then finding its way to 1323-1324 resistance area. After hitting its high at 1324, the market bounced between 1320 and 1324 into the close, closing near the bottom of that range.

The opening move higher completed a 5 wave sequence from Monday’s 1309 low. Wave 2 then completed at the day’s low of 1310. Another 5 wave sequence completed at 1324, completing 2 waves from Monday’s low. It is possible that wave 4 completed at 1319, with a lesser degree wave 1, and 2 finishing the day.

If this count is correct, wave 5 should terminate above 1340. Both the 5 wave sequence from 1309 and the sub-wave sequence from today’s wave 2, on the 60 minute chart. This scenario would remain intact unless wave 4 carries below the 1313 support level.
The above scenario assumes my current count is correct. That count is wave 1 from 1267 completing at 1336, wave 2 1307, and wave 3 from 1267 underway. Thus far from 1307, I have wave 1 of 3 completing at 1327, and a semi-inverted corrective wave 2 terminating Monday at 1309. This still seems to be the best count, as I still have trouble discerning 5 waves up from 1267.

Although I do not see a 5 wave sequence from 1267, it is possible that it has occurred. The move down from 1363 can also be seen as a wave 1 to 1346, and an inverted corrective wave 2 in progress. Under that scenario, the market would currently be in wave 5 of that sequence. The upper limit for this scenario is a wave 5 high of 1329. A move above that level would nullify that count, with my first scenario remaining intact. Should this inverted corrective wave scenario turn out to be correct, I would expect to see waves 3, 4, and 5 to the downside. This move could be rather sharp, and could carry the market down to the 1297, or 1290 support level. This would not, in my view, necessarily mean the market would move below 1267. It is entirely possible that this would be wave 2 from 1267.
Short-term, I look for a move above 1329, to result in wave 5 terminating above 1340. A move below 1310 would most likely see the market moving down to 1297, or 1290. Support remains at 1315-1313, with resistance still at 1323-1326.


Monday, June 25, 2012

Monday's Market 06/25/12

Let me be the first to admit that I was completely wrong about today’s market. I was looking for a continuation of the move up, and instead the market sold off in rather dramatic fashion.

The market gapped down, and soon found itself at the 1315 support level.  But the market was still not done. After a brief rally attempt, the market continued down below the 1313 support, to 1309. At that point the market was done, spending the rest of the day moving steadily higher to 1316.60, before fading into the close.

The SPX broke some of my important levels today, first breaking through last Thursday’s low, then the 1323-1326 support, then the 1315-1313 support, and finally 1310.51, before the rout was over. The 1311 level was important because it was the wave 2 low from 1307. This means that either my counts were wrong, or something else has been going on since that low. I still think my current counts from 1267 are the best ones, and instead of totally disregarding those counts, I have to look at other possibilities. I did get the count wrong for Friday’s rally, as it is now apparent that the move from 1327 to 1337 was a 5 wave sequence.

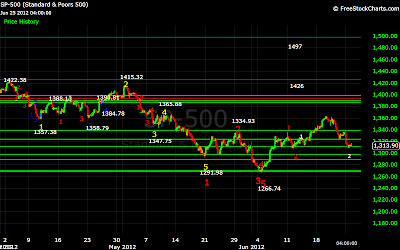
Although the SPX moved below the 1311 low, it did hold above the 1307 low. The simplest explanation, and one that keeps all of the 5 wave sequences thus far intact, is that the entire move from 1327.28, to today’s low of 1309.27, has been a semi-inverted corrective wave 2. I have super-imposed the labels to show that all the other sequences remain intact. An example of a semi-inverted corrective wave can be seen on the hourly chart. After the initial drop from 1422 to 1357, the market rallied to 1388, then formed a semi-inverted corrective wave to 1358.79. This count keeps all of my original projections intact, with 1393 being the most likely target for wave 3 from 1267.

From todays low, the market formed a 5 wave sequence to 1316.60. Short term resistance is still 1323-1326, with support at 1315-1313. Should the market fall below the 1307 low, a re-test of 1267 is probably next. At the moment I remain very cautiously bullish, but I will take it one step at a time.


Sunday, June 24, 2012

Weekend Outlook 06/24/12

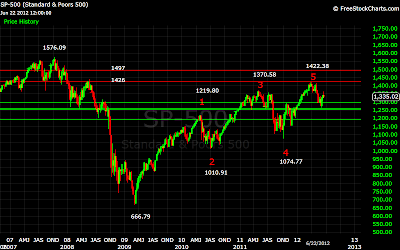
It appears that the market has reached a very critical juncture. In February of this year, as the market approached 1370, my model indicated that a 5 wave sequence from 667 was nearing an end, and the stage was set for a major correction. The market peaked at 1422, then fell to a low of 1267, at which point my model indicated the correction was at an end, but left open the possibility of slightly lower lows. Since then the market has staged a sizable rally, making it back to 1363 this past Tuesday.

As of last week, the market had completed a 5 wave sequence from 1267 to 1336. A 5 wave sequence down, to 1307, followed. These two sequences then became waves 1, and 2 of a larger sequence. From 1307, a 5 wave sequence of one lesser degree completed at 1327. This again became a wave 1, with the corrective wave to 1311 becoming wave 2. The market then completed 3 waves of one lesser degree at 1327, 1321, and 1343.

Last weekend, I outlined the most probable sequence to complete the waves from 1267. This included wave 3 of the sequence from 1307 terminating at 1367, wave 3 from 1267 terminating at 1393, with wave 5 of that sequence terminating at either 1426, or 1497.

The week started off rather flat, as the market completed an inverted corrective wave 4 from 1311. On Tuesday the market rallied, as wave 5 from 1311, and wave 3 from 1307 completed at 1363.46, very near the 1367 target. On Wednesday the market faltered, losing ground, but not undergoing the significant correction I suggested last week. Thursday, however, the market did undergo that correction, selling off to 1324.21, right within the 1326-1323 support. At this point my model suggested a 5 wave sequence from the 1363 high was near completion, and this was confirmed on Friday. The market opened higher, as my model suggested, tested Thursday’s low, again as suggested, and then moved higher the rest of the day.

So now, from the 1267 low, the market has completed 2 waves, at 1336, and 1307, and 3 waves of one lesser degree at 1327, 1311, and 1363 from 1307. A fourth wave from 1307, at 1327, may also have completed.

If wave 4 did, indeed terminate at 1327, the market would now be in wave 5 from 1307, to complete wave 3 from 1267, which I projected last weekend to terminate near 1393. This projection was based on the sub-wave structure of wave 1, which was the move from 1267, to 1336. Sub-waves normally give two separate projections. I chose this one because the other was much higher, and seemed less plausible. Having now completed wave 3 from 1311, to 1363, the sub-waves from that sequence can be used to create a projection to the same point, and the entire sequence from 1307 can now be used for a third projection to the same point. Using the first two projections, the target range for wave 5 can be narrowed to 1373-1381. Given a wave 4 termination point of 1327, however, the third projection does not fall into that range. If this scenario is to be the correct one, the SPX would need to continue the correction from 1363 a bit further, down to the next resistance level of 1313-1315. Given the wave structure of the corrective wave 4 from 1363, and the rally from 1327, this seems a low probability.

As I noted above, sub-waves usually generate two separate projections. The second projection using the sub-waves from wave 1 is near 1475. The second projection using wave 3, from 1311 to 1363, is near 1475. The entire wave structure from 1307, using 1327 as the wave 4 low, gives a projection near 1475. With all three projections converging on the same point, this seems the most likely scenario given the current data. This seems on the surface to be extremely optimistic, but that is where the data leads.

The third scenario is the one that says I am dead wrong. Given the current count, the move from 1363 cannot drop below 1310.51. If this happens, it would mean a 5 wave sequence from 1267 has most likely occurred, with the most likely outcome a re-test of the 1267 low. There is one possibility for this scenario, but the waves do not break down very well. Never the less, a break below 1311 would validate this scenario.
The most likely scenario seems to be the one that points to 1475. The corrective wave from 1363 unfolded as a nested inverted wave structure, a structure I have called out in the past. These structures normally indicate the end of a move, and are not usually found at the beginning of a move. This suggests that 1327 was the end of wave 4, and wave 5 from 1307 is now underway. This wave also terminated within the 1326-1323 support area.

The structure from 1327 also appears bullish. The waves thus far have been expanding, usually indicating a continuation of the trend. At least 3 and possibly 4 waves have completed from the low. Using that structure, and the sub-wave structure of wave 3, projects the current wave to terminate at 1358 short term. At that point the market will make a decision. If that turns out to be a wave 1, wave 3 will carry us above 1363, confirming a resumption of the uptrend, and possibly carrying the market back above 1400. Otherwise the market will turn lower. Support remains at 1326-1323, and then 1315-1313. If that support is broken, a break of 1307, and a resumption of the correction from 1422 is possible.

Saturday, June 23, 2012

Friday's Market 06/22/2012

The market opened higher today, quickly moving to 1334. As I mentioned yesterday, I was expecting a 3-4-5 formation this morning to complete the inverted corrective wave from 1346.45. The move to 1334 played out just as expected. Again, from there I was expecting another 3-4-5 wave sequence down, to complete the 5 wave sequence from 1363. This, too, played out as expected, with the market moving down to 1327. From there it was mostly up through the day, with the SPX first trading in a narrow range between 1329, and 1331, and then moving higher towards the close. After reaching the high of the day near 1338, the market faded into the close.

As I see it, the SPX completed 3 waves today from the 1327 low. Wave 1 completed at 1331.72, and wave 3 at 1337.82. It looks as if wave 5 of this sequence will take the market back near the 1358 resistance level. Support remains at 1326-1323, and then 1315-1313.

I will give a more complete update over the weekend.
Friday, June 22, 2012

Friday Midday 06/22/12

It appears this morning’s move to 1333.72 was the 3-4-5 wave up I was looking for. The following move down to 1327 was then the final 3-4-5 down from 1363.46. This completes a 5 wave sequence from that high, and possibly wave 4 from 1306.62. There is still the possibility of another sequence down, with a move eclipsing 1327 signaling this. I would then expect support at 1315-1313.

Thursday, June 21, 2012

Thursday's Market 06/21/12

This morning the market opened slightly higher, moving up to the 1358 resistance line, and completing a 5 wave sequence from yesterday afternoon’s 1347 low. The market then pulled back to 1349, and then tried to rally. The rally failed to move above 1358, only making it to 1352 before moving lower again. Once the SPX moved below 1347, it headed straight down, barely pausing on its way to 1324.

Yesterday I mentioned some positive wave structures developing, with a move above 1362 meaning a resumption of the uptrend, and a drop below 1347 indicating a continuation of the corrective sequence from 1362, with support between 1326, and 1324.
The contracting wave structure I talked about yesterday theoretically would have meant a break of 1347 would result in ever smaller waves, eventually leading to a move higher. The market circumvented this structure by forming an inverted corrective wave from 1347. This inverted corrective wave also contained an inverted corrective wave, resulting in the steep downward move we saw today. The decline did, however, end today right within the 1326-1323 support area I have identified, which completed a rather complex 5 wave sequence from 1362. This unfortunately only completes 3 waves from 1363, with another wave down to come.

It seems most likely at this point that the 5 wave sequence from 1363 will itself contain an inverted corrective wave 2. From 1363, 1346 would be wave 1, 1362 would then become wave 1 of an inverted corrective wave from 1346. Today’s move would be wave 2 of that inverted corrective wave. Today’s 1324.41 low should be the low of this inverted corrective wave. Wave 3 should be a move higher, probably less than 15 points, a move down terminating above 1324, and another move higher, again probably less than 15 points. At that point we would see waves 3, 4, and 5 complete from 1363. Wave 5 could complete back near today’s levels, or continue down to the next support level at 1313.
Near term, a move above 1327.22 from today’s low would indicate the scenario I outlined above was occurring. If the market breaks 1324, the down move will continue, perhaps to the 1313 support level.
Longer term, I current count remains intact. At this point the market would need to break 1310 before invalidating the current count.
Thank you for your interest.


Wednesday, June 20, 2012

Wednesday's Market 06/20/12

As I noted yesterday, the SPX finished a 5 wave sequence down from 1363 Tuesday afternoon at 1357. This morning the market opened higher, continuing the move up from that 1357 low. 1357 would soon prove to be only wave 1 of another sequence down, however, with today’s higher opening completing wave 2. The market quickly fell below 1357, dropping below 1355. The market then rallied to the 1358 resistance level, and fell back once again. After again falling below 1355, the market tried to rally again, but this time only made it to the 1357 resistance level. At that point the market fell sharply, dropping to 1346.45. This completed another 5 wave sequence from the 1363 high. A more robust rally ensued from there, and the SPX rather quickly found itself above 1361, completing a sequence from 1346. Almost as quickly as the market rose, it fell once again to near the previous low, but held above it. The SPX then rose into the close, making it back to 1355.

My outlook yesterday was fairly pessimistic, mostly based on the wave structure from 1363. In the move from that high, to the sequence low of 1357, the impulsive waves 1, 3, and 5, were increasing in length. That usually indicates the move has further to go. That played out today, as the 1357 low did not hold, and the market fell to 1346. The impulsive waves in this sequence were contracting, indicating the move may be nearing an end. The ensuing move higher, from 1346, to 1362, contains expanding waves, and the drop back to 1347 contracting waves. All these structures would indicate the move lower may be at, or near an end, with a move higher imminent.

I currently have this move as wave 4 from 1306.62. Thus far, the correction from 1363 has been 17 points, almost precisely that of wave 2 of this sequence, from 1327, to 1310. In the case of inverted corrective sequences, waves 1, 3, and 5 typically are very similar in length. This opens the possibility of the entire move from 1327.28 forming an inverted corrective wave. If this is the case, we should see another impulsive move higher, followed by another wave down of approximately 17 points.
Near term, a break of 1347 would indicate a further move to the downside, with support clustered between 1326, and 1323. Resistance is still at 1357-1358. If we move above that, I will be watching 1361. If the market moves above that, we should be on our way back up.
Thank you for your interest.


Tuesday, June 19, 2012

Tuesday's Market 06/19/12

The market gapped to the upside this morning, reaching 1353 in the first few minutes of trading. This opening move eliminated the two alternate scenarios I discussed yesterday, keeping my main count intact. After only a minor pullback from 1353, the SPX continued higher, moving to 1359, then 1360, and finally a strong move to 1363.46. After that strong move up however, the market quickly reversed course, dropping back near 1357 before finding support. The ensuing rally could only carry the market back to 1361.51, before moving back down to 1357. In the final minutes of trading, the SPX moved slightly off its lows.

The move today from my 1344 wave 4 low, unfolded in 5 waves, with wave 1 being the opening move to 1353. The second move of the day to 1358 was wave 3; with wave 5 subdividing into 5 waves, and terminating at 1363.46. This was very near our optimum wave 3 target of 1367. I was looking at three separate relationships all converging on that number, and today’s high satisfies my model in all respects.

It seems that the market has now completed a 5 wave sequence from 1307, and three waves thus far from 1267. From this point I was expecting a corrective sequence, and then wave 5 from 1267 to terminate near 1393. The move today from 1363 to 1357 breaks down into 5 waves. There is also support at 1358, and 1357, given the wave structure from 1307. If the corrective wave ends there, it now appears that wave 5 will carry above my original 1393 projection, and terminate between 1410, and 1414. This would complete the 5 wave sequence from 1267.
If the correction does not end here at 1357, things are a little less rosy. I mentioned support at 1358, and 1357, but there is then a large gap before the next support levels. The next cluster of support is between 1326, and 1323, and then between 1315, and 1313. While another move higher would still be in order, the wave 5 projection for this scenario would be between 1372, and 1381.

While there are other scenarios, these two seem the most likely. A move above today’s high of 1363 would spark another strong rally, moving the market above 1400 to the 1410-1414 level.
Conversely, a break below 1357 would result in what appears would be a rather significant sell-off into the 1320’s. This sell-off should hold above 1307, with wave 5 from 1267 terminating between 1372, and 1381.
Thank you for your interest.