Tuesday, July 24, 2012

Tuesday's Market 07/24/12

Well, I couldn’t have been more wrong the last two days. I was expecting the market to move higher, to 1397-1398, and instead the market has undergone a substantial sell-off. Although I have apparently misread several waves during this sequence, I still believe the market may stage a rally to 1395 that would complete wave 3 from 1367.

On Monday, the market opened sharply lower, dropping to 1338 before rallying in the afternoon. This rally took the SPX back near the 1357-1357 resistance level, reaching 1353. The sell-off continued into today, with the market moving lower, down to 1340, during the morning. After a small rally attempt to 1345, the market headed lower again. The market paused momentarily after moving below 1332, the SPX put in the low of the day at 1329.24. This level was close to the 1323-1326 support level, and above the previous 1325.41 low I have labeled as wave 2 of 3 from 1267.
From the recent uptrend high of 1380.39, the market has completed a 5 wave sequence at today’s low of 1329.24. This sequence contained an inverted corrective wave 2, which accounted for most of the damage the last two days.

The market is again at a critical level. If it can hold above the 1325.41 low, it still appears that the market is in wave 3 from 1267. The entire move from 1325 to 1380 can be seen as wave 3 of 3, and the move to 1329 wave 4. Given this count, wave 5 still projects into the 1393 level I have been targeting for this wave.
Since I have been wrong several times during this wave, I have gone back and tried to look at as many possibilities as I can. Looking at all these possibilities, there is a count that would make 1380 the termination point of wave 5 from 1267. This sequence would be 1363.46-1309.27-1374.81-1325.41-1380.39. I still don’t see 1267 to 1363.46 as a 5 wave sequence, as it must be for this count, but since this entire sequence has been difficult to identify, I will keep that as a possibility. If the market breaks below 1325.41, this would seem the most likely scenario.
The market is currently right at the 1338 support/resistance line. Resistance is now at 1357-1358, 1367, and then 1387-1397. Support is at 1323-1326, and then 1313-1315.

Sunday, July 22, 2012

Weekend Outlook 07/22/12

In my Medium Term Update a few days ago, I outlined a scenario that would put the market in wave 5 from 1267. While that scenario is still a possibility, the more likely scenario remains that the market is currently in wave 3. The wave structure at the moment pretty clearly points to this wave terminating around 1397, very near the 1393 target I have had for this wave. I will attempt to explain in detail my analysis of the wave structure from the 1266.74 low to the present. I will also elaborate on what I expect from here, both for the short term, and for the longer term, including my expectations for waves 4, and 5.

Since it is still a possibility, I will begin with a recap of the first scenario, in which this would be wave 5. Wave 1 took the market from the 1266.74 low, to 1335.52. This wave broke down into 5 sub-waves, 1266.74-1280.11-1272.78-1296.34-1294.96-1335.52. These waves yielded a model value of .9929. Using these sub-waves, I was also able to project wave 3 to occur at 1393, or 1475.

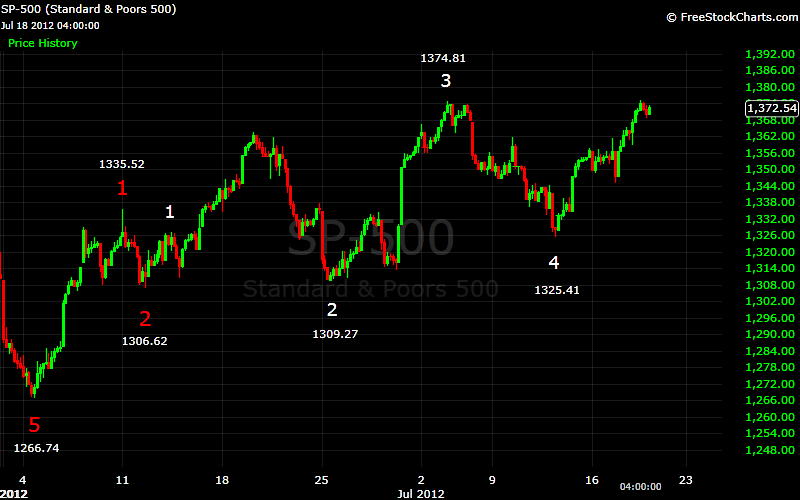
Wave 2 of this sequence turned out to be a complex semi-inverted corrective wave, which eventually terminated at 1309.27. This wave can also be broken down into 5 sub-waves, 1306.62-1363.46-1324.41-1337.82-1309.27, with a model value of .9959. Wave 3 followed, as the market moved to 1320.29-1310.30-1334.40-1313.29-1374.81. This sequence gives a model value of .9999. With this being wave 3 I expected this wave to carry to my wave 3 projection of 1393. Although 1375 has this within my model’s parameters for wave 3, I had expected it to carry closer to the 1393 projection. Wave 4 followed, breaking down into a 1346.65-1361.54-1336.27-1344.26-1325.41 sequence, giving a model value of .9961. These two waves will become important later as I discuss my scenario having the market currently in wave 3. Given the structure outlined above, wave 5 would be expected to terminate at 1383-1384.

 Usually at termination points of waves, projections start converging into a very narrow range. At this point, I have yet to see that with this scenario. Although this scenario is possible I see it as a low probability scenario at the moment. The preferred scenario still has the current move as wave3 from 1267, with that wave possibly nearing an end.

In this scenario, waves 1, and 2 remain the same. The difference in the two scenarios involves the next set of waves, which I have numbered as 3, and 4 above. This scenario would have this set of waves as wave 1 of 3 at 1320.29, followed by a complex inverted wave 2 with the structure 1310.30-1334.40-1313.29-1374.81-1325.41. This wave configuration has a model value of .9959.

So, for this scenario the count would be wave 1 at 1335.52, wave 2 at 1309.27, wave 1 of 3 at 1320.29, and wave 2 of 3 at 1325.41. The market then completed a 5 wave sequence from 1325.41 to 1361.32, with sub-waves 1338.42-1334.36-1347.63-1345.26-1361.32, and has a model value of .9925. This would appear to be wave 3 of 3, with wave 4 of 5 completing at 1345.07.
Wave 5 appears to be forming a rather extended 5 wave sequence, with waves 1, and 2 completed. Wave 1 of 5 sub-divided into 1354.82-1354.05-1359.04-1357.62-1360.78, giving a model value of .9999. Wave 2 was another complex inverted corrective wave, similar in structure to the wave 2 from1320.29 to 1325.41. This wave broke down 1358.33-1365.36-1358.96-1380.39-1362.19 from 1360.78. This sequence gives a model value of .9948.

As I mentioned earlier, at this point, I would expect projections to be converging into a narrow range. Given this scenario, that is exactly what is happening.
Wave 1 Sub-waves: 1280.11-1272.78-1296.34-1294.96-1335.52
Optimal Projection: 1393
Wave 3 Partial Waves: 1320.29-1325.41-1361.32-1345.07
Projected Wave 5: 1397-1434
Wave 3 of 3 Sub-waves: 1338.42-1334.36-1347.63-1345.26-1361.32
Projected Wave 5: 1386-1412

Furthermore, the sub-wave sequence of wave 1 of 5 of 3, projects a level of around 1382 for wave 3. A small correction from that point, near 1371-1379, would project wave 5 at 1397.
To summarize the above discussion, I would expect a move higher, near 1382 from Friday’s 1362 low. After a small pullback to 1371-1379, I would expect the market to move up to 1397-1412. This would complete a 5 wave sequence from 1309.27, and wave 3 from 1267.
My projections for wave 5 from 1267 remain either 1426, or 1497. If the market completes wave 3 at 1397 as expected, a small pullback for wave 4 would point to the 1497 target. A somewhat larger corrective, to around 1365, would point to 1426.

Friday, July 20, 2012

Thursday's Market 07/19/12

The market gapped up at the open, and continued to a new uptrend high at 1378.23 in the first few minutes of trading. The market then turned lower, giving up all of the early gains, and then some, as the SPX dropped to 1371.21. Another rally followed the pullback, and the market soon found itself once again in new uptrend high territory. This time the SPX made it to 1380.39, before pulling back again. The market again dropped near the 1372 level, and then staged a choppy rally back near 1378 into the close.

The early morning run up, and subsequent drop, appears to have been part of a semi-inverted corrective wave from Wednesday afternoon’s high. The following move to 1380 completed a 5 wave sequence from 1368.70, and wave 3 from 1325.41. We may have seen wave 4 with the pullback to 1372. If so, the market should be in wave 5, which could complete a 5 wave sequence from 1267.

In Wednesday’s Medium Term Update, I outlined a scenario for a 5 wave sequence from 1267 being close to completion. The current target for that wave would be between 1383, and 1397. If my current count is correct, I can narrow that forecast to between 1383 and 1384.
I will say again that the wave structure lately has been very complex, and there is a scenario in which this would complete wave 3 from 1267, and not wave 5. The projections for each are similar, with the wave 3 scenario most likely terminating between 1390 and 1391. This should clear up shortly, but as stated, the projected highs for each scenario are similar.
If the market moves up to 1383-1384, and then drops below 1372.33, it is most likely that a 5 wave sequence from 1267 has completed. Support is at 1367, 1357, and 1333-1336. Resistance is at 1383-1384, 1390-1391, and 1426.


Wednesday, July 18, 2012

Medium Term Update 07/18/12

Up until this point I have kept my current count from the 1266.74 low intact, even though I have had some reservations about it, which I have expressed from time to time. The main problem with this count has been the increasingly higher projections it has been giving with each completed wave. I have kept this count because I better one has not presented itself until now. At this time I feel a better option, or at least an equally good one, has appeared.

 I’ll start by reviewing my current count from 1267. This begins with the completion of a 5 wave sequence from that low at 1335.52. This is wave 1 in red on the accompanying chart. A corrective sequence to 1306.62 has been labeled wave 2 in red. A five wave sequence to 1327.28 completed wave 1 of a smaller degree, which is labeled in white. Wave 2 of this sequence I had labeled as a semi-inverted corrective wave, which terminated at 1309.27. Five separate 5 wave sequences then completed white wave 3, and another 5 waves down completed wave 4. That would have the market currently in white wave 5, which would complete wave 3 in red, of a 5 wave sequence from 1267.
The main issue I have had with this entire sequence from 1267 is the move from 1306.62, labeled wave 2 in red, and 1309.27, which is labeled wave 2 in white. From 1306, I have white wave 1, followed by wave 1 if the semi-inverted corrective wave in green, followed by waves 1 through 5 in yellow, which completed wave 2 in green of the semi-inverted corrective wave. This is followed by waves 3, 4, and 5 of the semi-inverted corrective wave in green, which terminates at wave 2 in white, or 1309.27.

While this count satisfies my model, it seems a bit convoluted. By simply using waves 1 through 5 in yellow from 1306.62, my model is also satisfied. I have refrained from using this count because the move from 1306.62 to yellow wave 1 doesn’t break down easily into a 5 wave sequence. However, this appears to be the simpler, and at the moment, better solution.

I’ve labeled this possibility as A-B-C-D-E on the chart for clarity. The move down from 1363.46 to 1309.27 is also interesting. A clear 5 wave sequence formed to 1324.41, and after a short rebound the market dropped to 1309.27. This entire wave breaks down into a 5 wave sequence the best, but for this discussion, I’ll also assume that it breaks down into two separate 5 wave sequences.
On the next chart I have replaced all the numbers with X’s to mark the 5 wave sequences I have identified.

And on this chart, I show the possible new count. This count would put the market in wave 5 from 1267, which projects to 1393.


Wednesday's Market 07/18/2012

After opening slightly higher, the market moved down to 1358.96. From that point the market staged a pretty powerful rally, moving above the previous uptrend high of 1374.81, making it to 1375.26. The market then pulled back, dropping to 1368.70, before rallying back to 1373.77. After pulling back slightly, the market moved higher into the close.

Yesterday I mentioned the possibility of a complex corrective wave forming, and it appears that is what has played out the last two days. After rallying off the 1325.41 low, the SPX completed a 5 wave sequence for wave 1 at 1361.32. From there, an inverted corrective wave formed, first taking the SPX down to 1345.07, before the strong rally to 1375.26. 1345.07 marked the end of wave 1 of the corrective wave, with the move to 1375.26 creating a series of 5 wave sequences of ever diminishing length. This completed wave 2. Waves 3, 4, and 5 took the market to 1368.70, which completed the corrective sequence, and wave 2 from 1325.41.

  I would expect the market to continue higher from here. I would now expect waves 3, 4, and 5 to complete at, or near 1393. While I have been looking at 1393 to complete wave 3 from the 1267, there is a count developing that would complete a 5 wave sequence from that point. I hope to elaborate on this later tonight. Either way, 1393 looks like an important point. What happens from there could determine the longer term direction of the market. While I think the market may correct from that level, I do not see a move back down to 1267.
Resistance is at 1387-1397, and then 1426. Support is at 1367, 1357-1358, 1337, and 1323-1326.


Tuesday, July 17, 2012

Tuesday's Market 07/17/12

The market opened higher today, moving above the 1356.70 level I thought would signal a resumption of the uptrend. Very quickly, however, the market turned lower, moving below the 1351.83 level I thought would result in a further correction. After moving above 1361 after the open, the market dropped back to 1345. After hitting 1345, the market rebounded, moving back above the 1357-1358 resistance level, and after dropping back to test it, moved higher once again. The market moved above 1365 for the high of the day, before falling slightly into the close.

The move higher from 1325 has turned out to be, like every other move lately, more complicated than I had thought. It now appears that wave 1 terminated at 1333.91, and was then followed by an inverted corrective wave 2 that lifted the market to 1357.7, before ending at 1348.51. Monday’s move to 1357.26, and drop to 1351.38 completed waves 3, and 4. Waves 1, and 2 of wave 5 completed at the close on Monday, and Tuesday’s opening move to 1361.32 completed waves 3, 4, and 5, and the 5 wave sequence from 1325.

The move down from that high was a 5 wave sequence, and the rally to 1365 contained a 5 wave sequence which terminated at 1360.78, which became wave 1 of a larger degree sequence which ended at 1365.36. This sequence contains waves of diminishing lengths, which usually indicates a reversal.
I still see this as part of a wave sequence that will take the market to 1393, but it appears we may still be undergoing a corrective sequence that will have to be completed before we resume the uptrend. This could take the form of a semi-inverted corrective wave that should take the market back between 1345, and 1361, and after a short rebound holding below 1361, should terminate somewhere below 1345. The other possibility is an inverted corrective wave, which would mean a pullback holding above 1345, and then a move back above 1365, followed by another small pullback.
Short term support is at 1357-1358, 1337, and then 1323-1326. Resistance is at 1367, and then 1387-1397. A move up to the 1387-1397 resistance level should mean either wave 3, or wave 5 from 1267 has completed, with a corrective wave to follow.


Monday, July 16, 2012

Monday's Market 07/16/12

After having run up from 1325 to 1358 on Thursday and Friday, the market spent today trading in a narrower range, undergoing some apparent consolidation before the next move. The market made an initial drop this morning, completing a 5 wave sequence from 1358 at 1348.51, which proved to be the low for the day. A scenario is developing which would make 1393 the termination point of a 5 wave sequence from 1267, and 1348 is precisely the pullback needed for this scenario.

From that low, the market proceeded to form a sequence of 5 wave sequences making a series of lower highs, and higher lows. The market moved higher to 1357.26, lower to 1351.38, higher to 1356.70, and lower to 1351.83, before rising slightly off that low into the close.

The structure that has formed from the 1358 high indicates a powerful move is forthcoming, but has formed in such a way that leaves open the possibility of a breakout in either direction. A move above 1356.70 would indicate another move higher, with 1393 remaining the most likely target, and a break below 1351.83 most likely resulting in a strong move back to the downside.
Resistance is at 1357-1358, 1367, and 1387-1397. Support remains at 1338, 1323-1326, and 1313-1315.
I mentioned above that a scenario is developing in which a move to 1393 would complete a 5 wave sequence from 1267. Up until now I have been calling this wane 3 from 1267. Both scenarios are still possible, but I wanted to acknowledge the existence of both possibilities. Due to other commitments, I was unable to put out a weekend update as planned. Instead I will post a Medium Term Update in the next day or two that will outline each of the different scenarios.


Saturday, July 14, 2012

Friday's Market 07/13/12

Yesterday I said I was expecting one more move down to 1318 to complete a 5 wave corrective sequence from the 1374.81 high. I also said there was a count that showed a completed sequence, with a continuation of the uptrend in progress. 1342 was the level I was looking at. I was looking for a move to that level, and then the move down to 1318. If the market moved above that point, the uptrend was continuing.

The market opened higher, and soon moved past that critical 1342 level, to 1347.5. After a small pullback, the market spiked higher, to above 1352, and then drifted higher for the rest of the session. In the last hour of trading, the market hit its high of 1357.70, right at my 1357-1358 resistance level.

The market has now completed a 5 wave sequence from 1374.81, at 1325.41. I have been calling this wave 4 of wave 3 from 1267, but I have voiced my reservations about that labeling for some time now. Ever since the 1306.62 low in early June, the wave structures have been pretty complex, and were starting to give rather high projections. I have felt for some time that a more complicated larger wave structure was developing and that at some point it would reveal itself, bringing the projections back in line with the 1393 original projection for wave 3 from 1267, and then 1426, or 1497. I think the market is starting to reveal that structure. I will be addressing that in more detail over the weekend, but for now, suffice it to say that the market is now on track to move up to 1393.

The current move should finally take the market to 1393, completing wave 3 from 1267. Support is at 1337, 1326-1323, and 1315-1313. Resistance is now at 1367, and then a cluster at 1387-1397.


Thursday, July 12, 2012

Thursday's Market 07/12/12

Yesterday I offered several scenarios for today’s market. The first involved a slight move higher into the low 1340’s followed by a move to the downside. This would have completed an inverted corrective wave 4 from 1374.81, and then wave 5. Another scenario had the market moving sharply lower if it broke 1336. This would be wave 5 down from 1374.81. My target was 1318, with support at 1323-1326, and then 1313-1315.

The market did open lower, dropping to 1331 in the opening minutes of trading. The market continued lower for the first hour and a half of trading, hitting a low of 1325.41. The market did find support at that level, and rallied for most of the remainder of the session. First the SPX moved up to 1334, and after a small pullback continued on to 1339. After another pullback, the market made a slightly higher high at 1339.93, and then fell back to 1334.41 near the close.

Today’s initial drop to 1325 broke down into a 5 wave sequence. The ensuing rally contained a 5 wave sequence to 1334, and another to 1339. I have been targeting 1325, and 1318 for some time, and today’s low of 1325 does offer a possible 5 wave sequence completed from 1375. However, looking more closely at the sub-waves of the sequences, it seems most likely that the move down today was wave 4 of an inverted corrective wave 4 from 1375. The rally after that were waves 1-3, and most likely 4, of wave 5 of that inverted corrective wave. If this turns out to be the case, wave 5 of that inverted corrective wave should terminate at 1341-1342, and then we should see wave 5 down from 1375. This wave should terminate at 1318-1325, with 1318 being preferable.

Thus, the perfect scenario for the conclusion of the 5 wave sequence from 1375 would be a move from here to 1341-1342, followed by another drop to 1318. Since the market rarely accommodates perfection, there are a couple of things I will be keeping my eye on. First, if the market rallies beyond 1342, I would assume the 5 wave sequence from 1375 ended at 1325. The uptrend should then continue. T o the downside, 1309, and 1306 are important levels. If the market moves below them, our count would be incorrect. As the market approached the 1375 high, I mentioned a possible count for the completion of a 5 wave sequence from 1267. I discounted this possibility because the market moved beyond the limits of my model. If the market moves below 1306, this may still be a possibility.
Support remains at 1323-1326, and then 1313-1315. My target remains at 1318. Resistance is at 1337, and then 1357-1358.


Wednesday, July 11, 2012

Wednesday's Market 07/11/12

The market opened modestly lower, but soon rebounded to 1345. Another drop to 1338 followed, after which the market traded in a narrow, up trending range, which brought the market back to 1343.66. The market then underwent another sell off, which took the SPX to the low of the day at 1333.25. At that point the market rallied, bringing it back to 1344.26, before fading into the close.

It appears the market completed wave 3 from 1374 yesterday at 1336.27. The moves from then seem to be either a semi-inverted corrective wave 4, or wave 4 from 1374, followed by waves 1, and 2 of one lesser degree. If this is a semi-inverted corrective wave, we will see a move slightly higher, near 1346, which would complete wave 4 from 1374, with wave 5 following, with a target of 1318.

If wave 4 has already completed at 1345, the move down should start, again with a target near 1318. If the market moves above 1346, it could continue higher, with resistance at 1357-1358, and 1367. A move below 1336.27 means the move down from 1374 is continuing, with a target of 1318.
The key levels for today are 1346, and 1336. A break of either of those levels should give us the short term direction of the market. Longer term, the market should still work lower, although I still view this as a corrective move, with higher prices to come.

Tuesday, July 10, 2012

Tuesday's Market 07/10/12

The market started the day to the upside on Tuesday, quickly moving up to 1361.54. Yesterday I thought this move would be wave 3 from Monday’s 1346.65 low, but I was wrong. I missed a small wave from 1347, and this move turned out to be wave 5. The market then turned lower, breaking through the 1357-1358 resistance level, and then moving down close to yesterday’s low. After hitting 1348 the market tried to rally, but could only make it back to 1352 before falling again. The selling continued, pretty much unabated, through the afternoon, until the SPX reached 1336.27. A rally off that low brought the market back to 1342.70 shortly before the close.

The action today, after the morning rise, was somewhat unexpected. This market has not been easy to follow as of late, and today was no exception. Longer term, I see still see a continuation of the uptrend at some point, the only question being when. I mentioned over the weekend that a move down to 1325, or 1313, would actually fit better with longer term projections. At the time I saw this as a low probability, with the expectation of a higher move this week.

The move today looked like a completion of 5 waves from 1346, and then 5 waves down to 1336. This would make three waves from 1375, with wave 5 projecting to 1313. So this move still fits within expectations. As I said before, this market has been difficult to read lately. The market could rally further from today’s low, but I see one more move down as probable. Support is at 1326-1323, and 1315-1313, with a target of 1313.
Resistance is at 1357-1357, and 1367. If the market moves above 1361.54, the market may have completed 5 waves down from 1375, and we may see a continuation of the uptrend.

Monday, July 9, 2012

Monday's Market 07/09/12

After completing a 5 wave sequence from 1374.81 on Friday, I was looking for a move higher today. Instead the market moved lower, moving just below Friday’s low of 1348.03. That low turned out to be wave 1 of another sequence lower, which played out today.

The market opened lower, and continued down through the morning. The first low came at 1347.44, and after a rally to 1352, the market out in a slightly lower low at 1346.65. This completed the 5 wave sequence, and the market rallied from that point. It rose to 1353, before falling back towards the previous low, but held at 1347.67. The market then rallied into the close, rising above 1353, before fading into the close.

As I stated above, the action today appears to be the completion of a sequence from the 1375 high. While it is possible for the market to form another sequence from that high, I feel this would only result in slightly lower lows. It does not appear that a 5 wave sequence has completed from today’s low, so I still think the market is headed higher.

Near term I have targets of 1356, or 1368. The 1356 target would be near the 1357-1358 resistance level. This would be wave 3 from today’s low, with another move higher expected after that. If the market moves much below today’s 1346.65 low, the market could be in the midst of a more prolonged corrective wave.
In summary, I am looking for a move higher, with an initial target of 1356, or 1368. This should signal a resumption of the uptrend from 1267. If the market falls below 1346 by a couple of points, this correction could be headed down to 1323-1323, or even 1313-1315.