Tuesday, September 22, 2015

Tuesday's Market 09/22/2015


The SPX gapped lower at the open, falling to 1939.75. This was within the 1935-1944 level I mentioned yesterday as possible support. The support was short-live however, as the index soon worked lower. The SPX soon fell to 1932.20, and then to 1929.22. By dropping below the 1935-1944 support, a further drop is indicated.


At 1929.22 the SPX completed a 5 wave sequence from yesterday afternoon’s 1971.66 high, labeled as Wave (c).  From that low the index rose to 1945.82. This looks to complete an inverted corrective wave from 1955.88, meaning the SPX should come under further pressure. At this point the index would now need to complete the sequence from 1979.64. After this completes the SPX should rally before undergoing a further drop to complete either a sequence from2020.86, or Wave E from 2079.46 on the Daily Chart.


Once this all completes the SPX should stage one more rally before starting the final leg down to below 1748.

Monday, September 21, 2015

Monday's Market 09/21/2015


On the Weekly Chart you will see my ongoing count from the March 2009 666.79 low. The first wave of this 5 wave sequence ended at 1219.80. Since then the SPX has been undergoing an inverted corrective second wave. Thus far four waves of this sequence have completed, with the fifth underway. The first four waves occurred at 1010.91-1370.58-1074.77-2019.26. The fifth wave of this sequence should complete below 1748 sometime after the first week of October.


The Daily Chart shows my count from 2019.26, the fourth wave of the sequence outlined above. This has been a quite complex wave, currently looking to form what I term a semi-inverted wave. Wave (A) of this sequence completed at 1820.66. The second wave rose above the previous high to 2079.46. Wave (C) is in progress, and should complete above 1820, with Wave (D) completing below 2019.26. Wave (E) should then carry the SPX below 1748. Wave (C) has proven challenging at times, and that may still be the case. Wave A of this wave completed at 1972.56 and Wave B at the recent 2020.86 high.


From that 2020.86 high, the SPX completed a 5 wave sequence down to 1953.45, and then a sequence higher to 1979.64. These could be Waves C, and D of (C). If this is the case Wave E should complete between 1935 and 1944. If 1935 is broken to the downside, it would likely mean that Wave C has not completed, and the index could move lower. If that level holds the SPX should rally, perhaps back to near 1990 before starting the final leg down to below 1748.

Thursday, September 17, 2015

Thursday's Market 09/17/2015

After a slightly lower opening the SPX drifted marginally higher throughout the morning and early afternoon reaching 2003.52 just before the FED announcement. After that announcement, the index spiked higher to 2008.33, fell to 1987.99, and then recovered to the high of the day at 2020.86. After that the SPX gave up its gains falling quickly to 1986.76. After rebounding to 2000.50 the index fell further to 1986.73.


Continuing my count from 1939.19 on the 5 Minute Chart, the SPX had completed Wave 2 yesterday at 1986.04. Wave 3 looks to have completed at 2008.33, Wave 4 at 2002.19 and Wave 5 at 2020.86. This would complete the sequence above the 2002 level I had mentioned, and below the 2028 level that would have put my current scenario in jeopardy.


On the 15 Minute Chart it would seem likely that Wave [d]did complete at 1939.19 instead of 1903.07 and Wave [e] today at 2020.86. I have at the moment labeled this with Wave (D) although this more likely to be Wave B looking at the Daily Chart. I will go into more detail on this, and the implications over the weekend, but this does not affect my 1748 downside target, only the form that the SPX might take getting there.


Wednesday, September 16, 2015

Wednesday's Market 09/16/2015

The pullback I said might happen at the open today did not materialize. Instead the SPX continued higher after a choppy opening. This choppiness was the conclusion of a small inverted corrective wave as the Wave from Monday’s 1948.36 low extended to 1993.99. After that the index did undergo a slight pullback to 1986.04 before continuing higher. On the 5 Minute Chart you will see the short term wave I am tracking from Friday’s 1939.19 low. So far Wave 1 has completed at 1963.06, and today Wave 2 at 1986.04.


Yesterday I mentioned an alternate count that would have Wave [d] completing at 1939.19, which would have Wave [e] completing above 2002. The count from that point so far supports that.  This can be seen on the 15 Minute Chart.


I am still expecting a further drop in the SPX to below 1748 after the first week in October. I had mentioned some time ago an alternate count that would have 1903.07 as the low for this correction. The decision point for these two scenarios would be 2028. If the SPX holds below 2028 my current scenario remains intact. If the index moves above that point, the alternate count would seem more likely.


Tuesday's Market 09/15/2015

After seemingly searching for direction yesterday, the SPX settled on moving higher today. From yesterday afternoon’s 1948.36 low, the index completed a 5 wave sequence higher to today’s 1983.19 high. Waves 1, 2, and 3 completed yesterday, along with Wave a of an inverted corrective Wave 4. This completed at 1967.01, and was followed by the surge to 1983.19 for Wave 5.


Along with my count from yesterday, this presents an interesting scenario. If you remember I moved my label for Wave [d] and Wave (D).  These waves, along with the first several waves I described yesterday actually form a complete 5 wave sequence as 1938.37-1911.21-1988.63-1967.72-1965.29-1939.19, meaning Wave [d] completed at that point, and the SPX has yet to complete Wave (D). So the index could move lower at the outset tomorrow, and then rally into Thursday. The target for this scenario would be 2002, slightly above the 2001 level I mentioned yesterday.


Even if the SPX breaches that 2001 level, there are still counts that would get it down to 1748, which remains my target. It should be an interesting couple of days.


Monday, September 14, 2015

Monday's Market 09/14/2015

The SPX continues its holding pattern, with the index trading in a comparatively narrow 15 point range today. From last Wednesday’s 1988.63 high, the SPX completed a 5 wave sequence down to 1967.72, and then formed an inverted corrective wave to 1965.29. Another sequenced down completed at 1939.19, one up at 1963.06, and another one down to 1948.36. In the short term this action seems non-committal, with a count supporting either a move higher or lower being possible.


In the medium term, I have one made one revision to my count. Looking at the count from the September 1st 1903.07 low, I had originally labeled the move to 1938.37 as Wave [c], the drop to 191964 as Wave [d], and the rise to 1975.01 as Wave [e] to possibly end Wave (D) on the Daily chart. The better count has a complex corrective wave forming from 1938.37 to 1911.21, for Wave [d], and Wave (D) completing at 1988.63.


This in no way alters my longer term outlook that the SPX has been in a complex corrective wave since the 2019.26 high last September that should complete below 1748 sometime after the first week of October. Any short term move would not change this, unless the index moves above 2001.


Thursday, September 3, 2015

Thursday's Market 09/03.2015

The SPX gapped higher this morning, reaching 1965.52 within the first half hour, and then continuing higher to 1975.01. This completed a 5 wave sequence from yesterday’s 1919.64 Wave [d] low. This sequence completed as 1919.64-1931.59-1920.29-1938.03-1929.00-1975.01 within the 1961.1989 range I mentioned yesterday for Wave [e]. From that point the SPX moved lower to 1963.73, and had a minor bounce to 1966.73. I have labeled these as a Wave 1, followed by Wave A. The index then completed a sequence lower to 1947.84 as 1966.73-1958.05-1961.75-1951.16-1959.34-1947.84, for Wave B. A more substantial bounce to 1958.87 which completed Wave C. One more move lower to 1944.72 completed Wave D, and the bounce near the close to 1956.28 Wave E and Wave 2 from today’s high.


Putting this all into context, this morning’s rise to 1975.01 completed Wave [e], and as I discussed yesterday Wave (D). This would mean that the SPX is now poised to make the next move lower towards my 1748 minimum target to complete the corrective wave from 2019.26 as seen on the daily chart. The implication of this afternoon’s drop, a Wave 1 followed by an inverted corrective Wave 2, is that this initial move lower has not completed, and the SPX should continue lower from this point.


Again as discussed yesterday, unless 1993.48 is broken to the upside, the SPX should head lower to below 1748. If Wave (D) did complete today, the first 4 waves of the sequence can now be used to project Wave (E). Those waves from the 2019.26 high, 2019.26-1820.66-2079.46-1972.56-1975.01 indicate that the termination point should be below 1744. This agrees quite well with the 1748 projection given by the first 4 waves of the inverted corrective wave from 1219.80, 1219.80-1010.91-1370.58-1074.77-2019.26.


Wednesday, September 2, 2015

Wednesday's Market 09/02/2015

It would seem that my logic yesterday was correct, however the analysis was not. I had called yesterday’s 1903.07 low Wave d of an inverted corrective wave that began Monday at 1965.98. I had anticipated a rally, and then one more wave down to complete Wave (e) yellow, and thus Wave [b] green. After today’s action it seems pretty clear that I was incorrect, and Wave d actually occurred yesterday, and the move to 1903.07 was the final wave lower.


By this count, the initial move higher this morning to 1938.37 can be seen as Wave [c] green, and the pullback to 1919.64 Wave [d]. Wave [e] of this sequence would need to complete below 1993 to complete Wave (D) dark blue of the long running corrective wave from the September 2014 2019.26 high. This would suggest that the final leg to below 1748 would begin once this wave completes.

Given the sequence so far, 1972.56-2093.55-1903.07-1938.37-1919.64, this current wave should complete between 1961 and 1989.

In my mind the SPX is now at a decision point, and it is a good time to discuss the main alternate count that paints a more bullish scenario. The corrective scenario I have been outlining has the September 2014 2019.26 high completing a 5 wave sequence from the October 2011 low of 1074.77. The alternate has the same count, but counts 2019.26 as Wave 1 of a higher degree wave. Waves 2, 3, 4, and 5 then completed as 1820.66-2079.46-1972.56-2093.55. This gives a complete sequence from 1074.77 as 1074.77-2019.26-1820.66-2079.46-1972.56-2093.55. I have already discussed above how yesterday 1903.07 low has completed a 5 wave sequence from the 2093.55 high. 1903.07 also would satisfy the criteria for the inverted corrective wave from 1219.80.


Tuesday's Market 09/01/2015

The SPX gapped lower this morning, dropping to 1931.41 within a few minutes. After bouncing around for a couple of hours, the index headed lower again to 1918.21. After another short consolidation period the SPX dropped to the low of the day at 1903.07, before staging a strong rally to 1920.41 in the last 15 minutes.


The entire drop today looks to have completed the sequence from yesterday’s 1986.26 high. As discussed yesterday, this sequence appears to be wave d of an ongoing inverted wave. Yesterday I said I would then expect a bounce of something less than 14 points. This was based on the point move for the first waves of the sequence. With the low in, this bounce could carry to 1946 and still satisfy my correlation criteria. During this inverted sequence, Wave c reached an oversold level on the 15 Minute RSI(5). It would likely that Wave d would also reach this oversold level.

Looking at the longer term count, I have labeled the 1993.48 high Wave (b) yellow. The drop to 1965.98 could have completed Wave (c), and the current inverted wave then would be Wave (d). After that the market should undergo one more decline for Wave (e).  


Tuesday, September 1, 2015

Monday's Market 08/31/2015

It has been an interesting couple of days. After trading up to 1993.48 on Friday morning, the SPX has traded lower from there. The move up to 1993.48 does seem to complete 3 waves up from the recent lows, which alters the Daily count slightly, but does not change the overall outlook for the index.


It may be better to start with the 
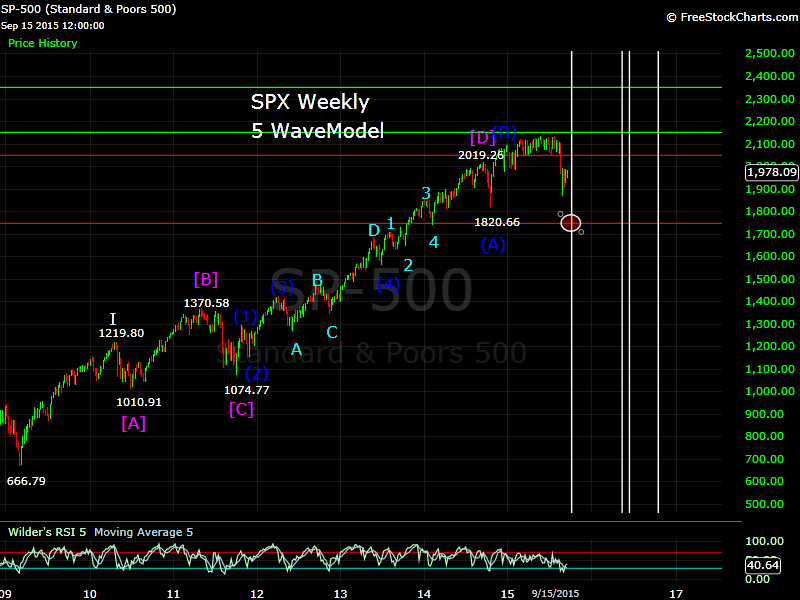
big picture at this point, and then work my way down. Working from the March 2009 low of 666.79, my count shows completed waves at 1219.80, 1010.91, 1370.58, 1074.77, and 2019.26. In my model Waves 1, 3, 5 of every sequence develop a certain relationship. Specifically, when the waves are taken as points, (start point, end point), the points exceed an R^2 value of .99. Since the three impulse waves that I mentioned above, (666.79, 1219.80), (1010.91, 1370.58), (1074.77, 2019.26, do not meet this criteria, one can assume that this sequence has not yet completed. Although my model is called the 5 Wave Model, it can also be thought of as a 9 wave model. Normally one corrective wave is what I term a complex wave, which breaks down into 5 waves with magnitudes similar to the others. The result is a sequence that displays 9 similar or related waves. My current view is that the move from 1219.80 has been just such a complex corrective wave, in particular one I call an inverted corrective wave. So we can look at the points (1219.80, 1010.91), (1370.58, 1074.77), and (2019.26, X). Given the correlation I described above, 1748 would be the maximum value at which the correlation would exceed .99.


The wave structure from the 2019.26 high has been quite complex and the structure hard to discern. My model is designed to identify the ends of waves, although it can provide some insight. Given the action of the past several days, I have relabeled some of the move from that high. Again, this does not change the target, but may provide some insight as to how we might get there.  My current count suggests that there are several waves that need to complete before ultimately reaching the low. It also appears that we may stay within the current range, 1867-1993, for some time as some of these waves complete. I will try to go into more detail in the upcoming days.


Shorter term the SPX completed a sequence at 1968.68, followed by three waves up to 1986.26. Another sequence completed to the downside at 1967.29 and was followed by a wave up to 1978.45. This suggests a sequence from 1986.26 has yet to complete. Once it does the SPX should move higher, likely completing a complex corrective wave from 1968.68. The three waves up from that point were likely waves A, B, and C, and the sequence from 1986.26 is Wave D. Wave E should the be something less than a 14 point bounce before the sequence from 1993.48 completes. I would expect this to come close to the previous 1867.08 low.