Thursday, March 16, 2023

Thursday Update 03/16/2023

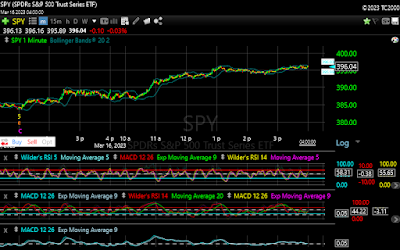
 SPY gapped down at the open, moving lower to 386.29. From there we saw some sideways action, with SPY moving between yesterday's close, and the opening low. Just before 10:30am, SPY began to move higher, reaching 394.45 before noon. After a slight pullback, SPY moved to 396.14. From there we saw mostly sideways action with SPY hitting a new high for the day at 396.47 shortly before the close, and closed at 396.04.


We have now seen a considerable rally off the Wave C low I identified yesterday. As I stated yesterday, once this wave completes, we should see a pullback near the magnitude of Wave A, which was ~5 points. This should then be followed by another wave higher to complete Wave 5 from the March 13th low.

Your support is appreciated.

Wednesday, March 15, 2023

Wednesday Update 03/15/2023

 It was another volatile day for the markets. SPY gapped down at the open, moving back to 385.70. It then bounced back to near 388 before falling once again. First to 385, and then 384.31 after another bounce. That once again found support, and SPY rallied back to 387 before falling to the low of the day at 383.71.

As has become the norm, SPY rallied in the afternoon, rising to 389.49 before falling back to the 387 level. But a rally in the last few minutes brought SPY back to near the high of the day, closing out the session at 389.36.


Before discussing today's market, I will first say I miscounted the last move up from yesterday. It was a 5 wave sequence that went (387.05, 388.46), (388.90, 390.64), (389.88, 392.18), with an R^2 value of .99414. Having done that, I will continue with today. If yesterday's last sequence was a Wave A, we can see the initial gap down, and subsequent choppiness can be counted as a 5 wave sequence, finishing Waves B, C, D, and E. (387.05, 392.18), (385.70, 387.16), (385.72, 387.72), with an R^2 value of .99209. Following that, we can count a 5 wave sequence into the day's low as, (387.72, 386.02), (387.44, 384.31), (387.37, 383.71), with an R^2 value of .99606.


Next I will widen out the view. This shows the wave I have been following from the Monday low. As we can see Waves 1, 2, 3, A, and B, remain the same. I had counted the low on the 14th as Wave C, but with today's action, the entire move from the Wave B high, to today's low can be counted as a semi-inverted corrective wave. This went (389.50, 385.05), (393.45, 387.05), (387.72. 383.71). This sequence has an R^2 value of .9897, slightly below the threshold of .99. However, it misses the threshold by .01. Using 383.72 as the end point yields .99011. Given the closeness, I will consider it within the margin of error, or slight misreading of the smaller waves. But this seems the best count.

This leaves us in Wave D, which is moving higher. Once this wave completes, we should get a move lower, with a magnitude similar to the Wave A decline. That would conclude Wave 4, with another move higher for Wave 5.

With the current volatility, and uncertainty surrounding the market, things can change quickly. 
Tuesday, March 14, 2023

Tuesday's Update 03/14/2023

 SPY gapped up this morning to 390.44 off yesterday's low of 385.05. The rise continued into midday, with SPY reaching a high of 393.45. After attaining that high, SPY gave back some of the gains through the afternoon, hitting a low of 387.05 after 3:00pm. From there SPY rallied again, finishing the day at 391.68.

If we look back at yesterday, a short term count becomes apparent.


From yesterday's early morning low, we see SPY rose in three waves to 390.39 Following that, we see a three wave decline to 385.05. Those waves can then be counted as Waves 1, 2, and 3, followed by three waves, A, B, and C of an apparent inverted corrective wave. This implies a move higher, followed by a decline. 


This morning we saw SPY rise in a 5 wave sequence, (385.05, 391.92), (390.37, 392.99), (391.90, 393.45), with an R^2 value of .99313. This move took us to 393.45, just slightly above the 393.16 high I talked about yesterday. This indicates the bearish count could be reversing itself. There are still a number of ways this could go, but for the moment it looks like the SPY has avoided the immediate move lower.

After that high, SPY moved lower, forming a Wave 1 at 392.01. From there we saw an inverted corrective wave, (392.01, 392.74), (391.57, 392.51), (388.35, 390.53), with an R^2 value of .9995. That completed Wave 2, and the entire sequence from 393.45 as (393.45, 392.01), (390.53, 387.71), (390.00. 387.05), with an R^2 value .99959. The rise from there can be seen as a Wave 1, followed by an inverted corrective Wave 2. 


Looking at the two days together, we can see that today's completed Wave D of the inverted corrective wave, and today's low Wave E, and thus Wave 4 from yesterday's low. With four waves completed, we can now project Wave 5 to complete at 393-395. 

Thank you for your support.