Wednesday, February 22, 2023

Market Update 02/22/2023

 Given the oversold conditions the market closed at on Tuesday, it would not have been unexpected for the market to attempt a rally this morning. Initially it did, as the market opened slightly higher to just above the 400 level. That was short-lived however, as the market soon resumed it's downward trajectory, falling once again below the 400 level to 397.62. Another, more sustained rally took hold from there, and the market enjoyed a steady rise to near the 401 level ahead of the Fed Minutes. The market swung higher and lower immediately following the release of those minutes, before again deciding on a downward path. SPY once again tested the 397 level right before the close, before rallying to close at 398.60.


Yesterday I mentioned the shorter time frame charts being noisy. Today's action seemed to clarify some of that, and while still noisy in spots, some things have come into clearer focus. Counting from the recent 418.31 high, I am counting the initial move down to 407.57 as Wave 1 of this move lower. The market then moved in sideways fashion to 416.49 - 405.01 - 415.05, which can be counted as Waves A - B - C of an inverted corrective wave. After that, the entire move down to today's low of 397.02 can be counted as a 5 wave sequence for Wave D.


In the short-term this count implies a move higher. Given the structure of the inverted corrective wave to this point, the Wave E target would be between 407 - 412. From that point we may see another move down. My work still shows a downside target somewhere below 396. For now I'll leave it there and follow this a wave at a time.

If you find value in this analysis, please consider a donation to help us continue our research.
TSLA Update


Tuesday, February 21, 2023

Tuesday's Market 02/21/2023

 The market got off to a rocky start with a gap down opening. SPY hit 403.15 shortly before the open, and made a feeble attempt at a recovery during the opening 15 minutes. This recovery could only lift SPY slightly more than a point before it resumed to the downside. This slide lasted into the afternoon with hardly an attempt at a rally. SPY fell below the 400.00 level dropping to 398.82 before another attempt to the upside was mounted. The 400.00 level then turned into resistance, as SPY topped at 400.16 before falling once again into the close. It closed at 399.14, only slightly above the worst levels of the day.

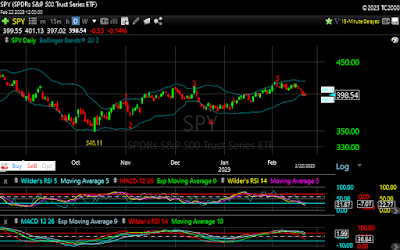
Looking at the daily chart, one can count a completed 5 wave sequence from the 10/13/2023 low of 348.11 to the 2/2/2023 high of 418.31. This sequence can be counted as 348.11-390.39-368.79-410.49-374.77-418.31. This sequence has an R^2 value of .9965, which satisfies my model. 

The first thing I notice about this sequence is that it lacks an extended corrective wave, which one would normally see during an impulse wave. Thus it give the appearance of an A-B-C correction from the 348.11 low. If one draws a tend line connecting the 348.11 low and the 374.77 low, one will notice that the market came very close to that line today, indicating that we may be at an important juncture. 

Technically, the Daily SPY chart shows an oversold condition on the RSI, but the MACD shows a bearish crossover. 

The shorter term charts have been less clear. One possible count shows a short term 5 wave sequence could complete between 396-386, but the technical action may provide better clarity to shorter term direction. 


If you find this information valuable, please consider a donation so we may continue our research.

One More Move Higher for TSLA?

 TSLA has been on a relentless tear since putting in a low at 101.81. After an initial move higher to 123.52, TSLA moved sideways, bottoming at 115.60. From that point it was almost a straight line up to 214.00, with only short pauses along the way. Once hitting 214.00, TSLA had a slightly deeper correction to 187.61. That did not last long, however, as the stock quickly recovered and out in a new high at 217.65.

My analysis shows Wave 3 of a 5 wave sequence completing at that 217.65 high. The subsequent pullback to 197.50 was likely Wave 4, with Wave 5 currently underway. If this count is correct Wave 5 should carry TSLA to a new move high. The maximum price for the sequence as described would be 240.00.

TSLA appears to be in Wave 5 of the current 5 wave sequence, and should complete this sequence between 217.65, and 240.00. A move below the previous 197.50 low would likely mean that the sequence has completed. After this move, I would look for a more substantial pullback.


 If you find this analysis helpful, please donate so I can continue bringing it to you.