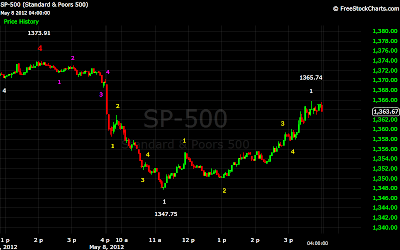
From our perspective, the market completed an inverted corrective wave from 1363, and then a 5 wave sequence from 1365.74, which terminated at 1343.13. This, in our opinion is wave 1 of a 5 wave sequence from 1365.74, which will eventually carry us down to SPX 1325. We would expect a bounce off, 1343, then a drop to 1331, and after one more bounce, a final drop to 1325. This would complete a 5 wave sequence from 1415, and wave 3 from 1422. We would expect a more significant rally at that point.
This blog introduces a new way to analyze the stock market. The 5 Wave Model uses relationships between up and down movements, or waves, in the price action to determine turning points in the market.
Wednesday, May 9, 2012
Tuesday, May 8, 2012
Tuesday's Market
Another interesting day, with the market opening sharply lower, which continued the move down from yesterday’s 1374 high. That opening drop completed a 5 wave sequence from that high, but that would prove to be but wave 1 of a larger 5 wave sequence. After completing the sequence the market moved slightly higher, rising to 1363, before continuing down. This move saw the SPX drop first to 1352, where wave 3 terminated, and finally to 1347.75, completing the 5 wave sequence.
Here the market found some buyers, and they quickly drove the market back to 1355. After falling to 1350, the buyers stepped in again and carried the market higher for the rest of the day. At 1359 we believe wave 3 of this corrective wave was completed, and after a brief pullback the SPX powered ahead to 1366. We believe this completed the 5 wave corrective sequence from 1348. The market pulled back slightly from that level, but remained fairly steady into the close.
We believe the move from 1374 to today’s low of 1348 represented wave 1 of a yet to be completed 5 wave sequence. We still do not see a completed 5 wave sequence from 1415, and believe this sequence will terminate when we have completed the sequence from 1374. While the rally off today’s low was a bit more than expected, it kept our current wave count intact, and played out in well defined 5 wave sequences. Only a rally above 1374 would invalidate the current count, with a move above that level pointing to a more extended rally at the minimum.
Our current outlook is that we are about to, or have just, started wave 3, of wave 5, of wave 3, from the 1422 high. We expect the SPX to complete wave 3 from 1422 somewhere below 1331. With the wave structure today, it is possible that it will be significantly below that level. From there we expect a wave 4 rally, and then a final low to complete wave 5 from 1422. Only then can we think about making new highs.
We will caution again that our waves can take many different forms, and we can only be certain of that form when a wave sequence has terminated. We are offering here our best interpretation of the wave structure given the available data.
Monday, May 7, 2012
Monday's Market
Overnight the futures were down quite dramatically, putting in jeopardy the bounce we were looking for today. The SPX opened lower, dropping to 1364 before quickly recovering to 1370 and turning positive for the day. From there the market dropped back to 1367 moved back towards 1370, and then fell to the low for the day at 1363.94. The market then experienced the bounce a bounce, spending the rest of the morning, and early afternoon trending higher, reaching 1373.90 by 2:00PM.The last two hours of the session found the market moving lower once again, falling back to 1368.48 before moving slightly higher into the close.
We believe the drop this morning was a continuation of the move from Friday’s 1372.41 afternoon high. To us this looked like wave 2 of an inverted corrective wave from the 1367.96 low from Friday. This corrective sequence completed at today’s high of 1373.91. If we are correct that would complete wave 4 of the sequence from 1415.32. This would mean that wave 5 of that sequence is underway now, and we believe this will take the market down to 1331.
We’ve included a chart of how we believe the entire wave sequence from 1422 will play out. This is based on the wave sequence thus far, and the points that best fit our model. After the drop to 1331 for wave 3, we see the market rising again to 1411, before falling once more to 1320. These projections were developed using my main model criteria, along with several others that I have been developing. Again, waves can, and do, develop in many different ways. This is simply my interpretation of the wave structure, and the most likely outcome at the moment. It should be taken as nothing more or less.
Subscribe to:
Comments (Atom)


