It was another up and down for the SPX today. This
choppy action has been the norm for the better part of four days, and has been
difficult to follow on the short term. I thought it best to focus on the longer
term today, and outline the possibilities as they stand at the moment.

Looking at the Weekly chart, I identified 4 waves
that completed from 1074.77 to 1560.33, with the SPX needing only to complete
the 5th wave to complete the sequence from 1074.77.
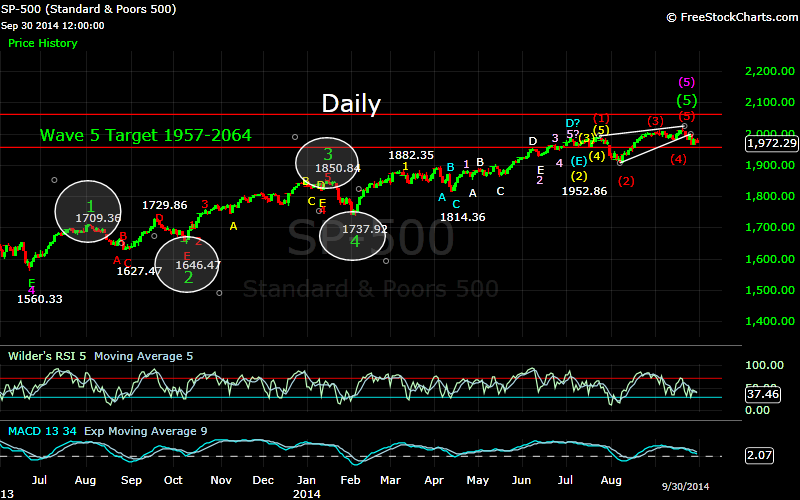
On the Daily chart I identified a complete 5 wave
sequence from 1560.33 to the recent 2019.26 high. The completion of this wave
at 2019.26 would complete the 5th wave from 1074.77, and therefore I
have been looking at that point as the termination of a 5 wave sequence from
1074.77. Unless the SPX moves above 2019.26 it appears the index is in the
beginning stages of a correction of that sequence.

On the 60 Minute chart, the initial decline to
1978.63 looks to be a first wave a sequence lower. From that point, the SPX
moved higher to 1999.79, lower to 1965.99, back up to 1986.37, back down to
1964.04, and then made one more move higher to 1985.17. Looking at this
sequence gives 1978.63-1999.79-1965.99-1986.37-1964.04-1985.17. The points
(1978.63, 1999.79), (1965.99, 1986.37), (1964.04, 1985.17) gives an R^2 value
of .99756, meeting the parameters for a 5 wave sequence, and possibly the
completion of an inverted corrective wave from 1978.63, or the second wave from
the 2019.26 high. If this count is correct, I would expect a resumption of the
decline from this point.
My concern with this count is the shorter term
counts, which makes it difficult to be certain of this count. After the initial
decline from 2019.26, I had somewhat expected a slightly different correction
to form, namely a semi-inverted corrective wave, which is still a possibility.
If it does occur now, it would actually contain another semi-inverted
corrective wave within it. This would look something like this:

If this scenario does play out, the SPX should
move up to 1989, pullback with the index holding above 1978.48, and then move
above 1999.79, but falling short of new highs. The next few days should give us
a good idea of which path the SPX is taking.
No comments:
Post a Comment