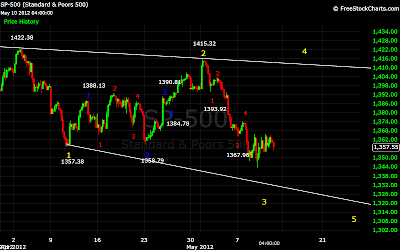
We were expecting a slightly lower open today, in order to complete a 5 wave sequence from 1363.73, before possibly moving higher. Instead, it appears that 5 wave sequence terminated yesterday at 1354.32, and this morning we gapped to the upside. The market rose to 1365.88, taking out the 1365.74 high we mentioned in yesterday’s post. After shooting up to 1366, the market quickly fell back, dropping to 1357. From there the market moved higher to 1362, before falling back to 1357. The market rallied off that low, hitting 1365 before falling back. This drop continued into the close, with the SPX falling to 1355, before moving slightly higher at the close.
With the SPX moving above 1365.74, that point could no longer be wave 2 from the 1374 wave 4 high. The move from 1348 to 1366 now appears to be a semi-inverted corrective wave, a possibility we discussed in our earlier post. We expected to see a high of 1368-1369 for that wave, but that no longer seems to be the case. From 1366 it looks like the market completed a 5 wave sequence at 1357, followed by a 5 wave corrective sequence to 1365. We count another 5 wave sequence terminating at 1359, and a subsequent break of that level. This seems to point to lower prices immediately ahead, with 1365.88 the wave 2 high from 1374.
In our view the market is entering a critical juncture, and we will dispense with any speculation for the moment, and stick to what we know, or at least what we think we know.
By our count we are in wave 5 from the 1415 high. Wave 3 of this sequence was significantly longer than wave 1, and thus we expect wave 5 to be longer than wave 3.With waves 1-4 identified, we can project a low for wave 5. The minimum level for that low is 1325. The range we see for this low is quite large, which normally suggests wave 5 will terminate in a spike that could carry well below 1325.
From the wave 4 high of 1373.91, we identified wave 1 of 5 at 1347.75. From there a semi-inverted corrective wave developed, taking the market back up to 1365.88. Semi-inverted corrective waves are generally indicative of strength in the underlying trend, which in this case is to the downside. On our 60 minute chart you can see that following the semi-inverted corrective wave from 1388 to 1359, the market rose sharply to 1415.
From this afternoon’s 1365 high, we identified a 5 wave sequence to the downside, with a breach of that level after a very short bounce. This could mean an inverted corrective wave is underway, which usually manifests itself in very sharp moves, with very small intervening corrections.
All this leads us to a very bearish short-term outlook, with our target below 1325. From there we would expect a fairly significant bounce. At the moment we’ll leave it at that.
Always leaving open the possibility that we are wrong, the level to watch is 1373.91 wave 4 high. If the market moves above this level, our current counts would be incorrect, and we would be looking for a move higher. The market does seem like it wants to move higher, but in our view is just not ready. There is also the slight possibility that the semi-inverted corrective wave from 1348 has not yet completed, and will move up to our 1368-1369 target. We see this as a low probability, but possible, which is why the 1373.91 level is much more significant.


The design of this blog is good, I am also thinking to make such blog for my business, thanks, this is really great, keep it up.
ReplyDeleteTrading in Commodities