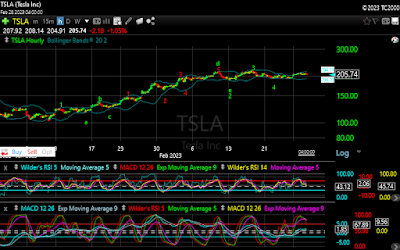
If you read Monday's Update, you had a pretty good roadmap for today's session. In that update I said I was expecting a move higher at the open, followed by a 6-8 point pullback. TSLA did open higher, gapping up and hitting a high of 211.23. It is notable that it stopped just shy of the 212 lower bound that would end the sequence from the 101.81 low. It is nice when a forecast comes to fruition, but obviously they will not all be that good. But the accuracy does speak to the forecasting power of my model. Some set-ups lend themselves to highly accurate forecasts, while others are more difficult. I thought I would walk through what I saw yesterday in the set-up, and how I was able to arrive at those forecasts.
This blog introduces a new way to analyze the stock market. The 5 Wave Model uses relationships between up and down movements, or waves, in the price action to determine turning points in the market.
Tuesday, February 28, 2023
TSLA Tuesday Update 02/28/2023
Monday, February 27, 2023
TSLA Update 02/27/2023
Friday saw a gap down for TSLA, falling to 192.80 shortly after the open. TSLA then traded in a narrow range, with a slight upward bias, throughout the day. The fact that Thursday's 191.78 low held was important, as that is my Wave 4 low, and a break below 187.61 would invalidate the count, and likely mean a top was in. After holding those levels, TSLA moved markedly higher at the open, gapping up to 208.22 before a slight pullback. Another move higher brought the stock to 209.42, which proved to be the high of the day. From there TSLA fell slightly into the close, ending the session at 207.60.
A very short term count would call for a move higher from the close, followed by a pullback of 6 to 8 points. This move higher has a lower limit just below today's high, but the upper limit gives it a large range to work with. That would set up a final move into the 212-234 target area mentioned Thursday. On a cautionary note, another move higher at the open could put TSLA in that target range, so close monitoring will be needed from this point. One possibility would be for the initial move higher to carry to a point where the 6-8 point pullback keeps it above the 212 target.
On the downside, I am watching the 191.78 and 187.61 levels. A break of those would seem to be near term bearish. Should be an interesting couple of days.
Monday Update 02/27/2023
In Thursday's Update I mentioned the possibility of another move down for SPY, probably below 396, followed by a move higher. Friday opened with a gap down, opening just below that 396 level at 395.54. Most of the day was spent bouncing around the 394-396 level, with only a couple of failed attempts to break through that 396 level. Today opened on a firmer note, with SPY gapping up back to the 400 level. I have also mentioned 402 as a near term resistance level, and SPY reached 401.29 before spending the rest of the session giving back most of those gains, falling back to 396.75 before rallying slightly into the close.
Friday's drop below 394 was slightly more than I was anticipating, which again still leaves several possibilities from this point. There is still short term resistance at the 402-403 level. The primary short term count still calls for SPY 406-411, but the 402-403 may be all it can muster.


