Friday, November 21, 2014

Thursday's Market 11/20/2014

The SPX gapped down at the open this morning dropping to within .12 of yesterday’s low at 2040.49. The index reversed at that point, closing the opening gap as it rose to 2048.57. After a small pullback the rally continued as the SPX reached 2051.91, and then 2053.84. Once the SPX reached that level, it began to pull back again, first falling to 2050.37, and then 2049.35 before staging another small rally into the close.


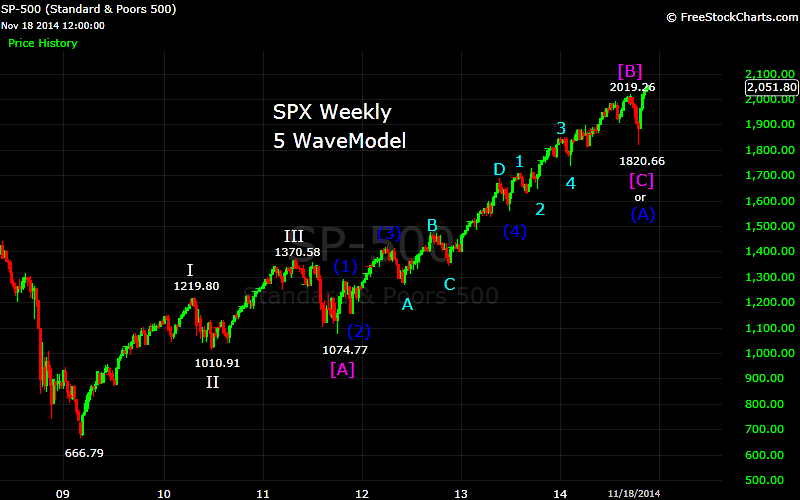
As noted previously, the SPX completed a 5 wave sequence from 2001.01 at 2056.08. This completed Wave 3 of a 5 wave sequence from the 1820.66 low, with Wave 4 then completing at 2040.37. From that low the SPX completed a 5 wave sequence at 2052.14 for a wave 1, which was then followed by an inverted corrective wave 2 that completed today at 2049.35.

With what appears to be 4 waves now completed from the 1820.66 low, a target for wave 5 of the sequence can now be calculated. This target is between 2072 and 2126. This is a large range at the moment, but near the 2070 target area mentioned here for awhile. As the current wave unfolds a more accurate range should be able to be determined.


Tuesday, November 18, 2014

Tuesday's Market 11/18/2014

The SPX opened higher this morning, and then gained momentum as it rose to 2049.98. A slight pullback followed, as the index dipped to 2046.42, where it moved ahead once more, finally topping at 2056.08. Once that mark was reached the SPX pulled back again into the close.


I have been looking for the SPX to complete a 5 wave sequence from last Thursday’s 2030.44 low between 2053 and 2063 which would complete the sequence from 2001.01. It looks like this happened today at 2056.08. There is support at 2042, and then 2035. A pullback to either of those levels would put a final rise to above 2070 well within reach.

A move above today’s high without a larger pullback could mean the wave from 2001.01 has not completed, and still has a ways to go.


Monday, November 17, 2014

Monday's Market 11/17/2014

Since falling to 1820.66 a month ago, the SPX has made a strong move to the upside. The rally was swift at the beginning, with the index gaining 100+ points in 13 trading days. Since that point the index has only managed a gain of just over 20 points over the next ten sessions.


Looking at the wave structure from the 1820.66 low, the SPX completed a wave 1 at 1869.00. Wave 2 was then an inverted corrective wave, completing as 1835.02-1949.31-1926.83-2024.46-2001.01. Inverted corrective second waves usually produce a strong move in the direction of the higher degree trend, just as it did here. Waves 3, 4, and 5 are then less explosive, as seems to be the case here thus far. From the 2001.01 low, the index has formed 4 waves, at 2025.32-2015.86-2041.28-2030.44, which generates a target for wave 5 between 2053 and 2063. Once this completes the SPX should pullback, and then move higher once more to complete the sequence from 1820.66. 2070 still seems to be a good target.


There is a possible, but less probable count that has the recent 2046.18 high as the completion of the wave from 1820.66. If the SPX moves below 2030.44 this scenario would become most probable, with a move below 2001.01 likely confirming the top was at 2046.18.