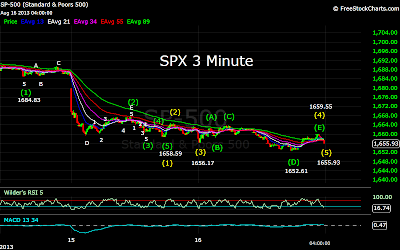
Coming off the brutal down move from yesterday,
the SPX had a somewhat calmer session today, trading within a narrower 13 point
range, but still moving to the downside. The index started slightly to the
downside, and shed several more points as it fell to 1656.17. The SPX then
started to move to the upside rising first to 1662.43, and then 1663.60 after a
small pullback. That high brought on another round of selling, as the index
fell into the afternoon, hitting another near term low of 1652.61. Another rebound
followed, but after rising to 1659.55, the SPX fell again into the close.
Yesterday I said that the SPX had completed a 5
wave sequence down at 1658.69, would likely experience more movement to the
downside, with support at 1651, and then 1621. The SPX did move further to the
downside today, and made a low at 1652.61. It appears that the index completed
a larger degree sequence from the 1709 high today. Using yesterday’s 1658.69
low as Wave 1, the rebound to 1664.58 was Wave 2. This morning’s drop to
1656.17 completed Wave 3, and was followed by an inverted corrective wave 4
that completed at 1659.55. The late afternoon fade to 1655.93 would then appear
to complete Wave 5, and the entire sequence from 1709.
The SPX has now completed a 5 wave sequence from
1709 right at the first support level. This was accompanied by extreme RSI(5)
readings on the 60 Minute chart, and a positive divergence. The short term
chart shows a lower RSI(5) reading as compared with the 1652.61 low, with a higher
index level. This also could be a short term positive. A move above 1660 would
likely indicate that a rebound is underway, with resistance at 1669, and then
1685. Support is at 1651, and then 1621. A move below the 1651 area would
indicate the SPX may be headed to the next support level.
While it is still possible that this is the end of
the correction, and that the market is on its way higher, it is becoming more
and more likely that there is a substantial move down ahead before the move
higher can begin. My reason for the 1776
target level has been the longer term count as seen on the Daily chart. I have
counted Waves 1, 2, and 3 completing as 1292.66-1158.66-1422.38. I then saw an
inverted corrective wave completing as 1266.74-1470.96-1343.35-1687.18-1560.33.
The alternative counts would require many more waves to complete before the end
of the uptrend from 1074.77, and seemed very unlikely. A very interesting
alternative has begun to emerge. In this scenario, everything up to the 1687.18
high would remain the same. It is then possible for Wave E of that large
inverted corrective wave to be forming a complex wave, in this case, a
semi-inverted corrective wave. Wave A would be the move from 1687.18 to
1560.33. Wave B from 1560.33 to 1709.24, and Wave C underway. In these complex
waves Wave C would need to complete above 1560.33, Wave D below 1687.18, and
then Wave E below 1560.33.
As I have mentioned, support is at 1651, and then
1621, both above 1560.33. Resistance is at 1669, and then 1685, both below
1687.18. The other thing I need to keep n mind is the fact that the end of this
wave must also complete within the range to complete the longer term inverted
corrective wave, which has a lower boundary of 1542. This gives a fairly narrow
range to work with, as this wave must then complete below 1560.33, and above
1542. An initial move to 1651 or 1621, followed by a rebound to 1685, would
both satisfy those conditions. In the first case Wave E would project to 1651,
and in the second, 1654.
In essence this means that the entire move from
1687.18 could be one complex correction, projecting a low of between 1560.33
and 1542. Since the low of this move would approximate the 1560.33 low, the
ensuing move higher would project into the same range, namely the 1776 area.


