Friday, April 5, 2013

Friday's Market 04/05/2013


In hindsight, I should have kept my thoughts to myself yesterday, and stayed with my unorthodox call on Wednesday of a 5 Wave sequence from 1538.57 being completed at 1564.86. This would be Wave 3 from 666.79. The action of the market today, in particular the move below 1545.90, confirmed at minimum that a 5 wave sequence from that low had completed.

The SPX also broke below 1547; the level I mentioned yesterday as indicating a downtrend was most likely underway. That downtrend may indeed have started, but the fact that the market remained above 1538.57 may mean there is one more surprise in store.

 
If you look at the 3 Minute chart, you will see that from the 1564.86 high, the market completed a 5 wave Sequence down to 1549.80, a 5 Wave sequence up to 1562.60, another 5 Wave sequence down to 1552.52, and a final sequence up to 1560.26. This higher low, lower high formation can be an indication of a nested inverted corrective wave, and that is exactly what happened today. The market gapped down at the open, dropping to 1539.80. For the next hour the SPX bounced in a narrow range, hitting a low of 1539.50. This choppy trading will prove to be the most important aspect of today’s trading.
After bouncing around the 1539.50 low, the market staged a rally that carried all the way to the close. After rising to 1548, the market again bounced around in a narrow range until shortly before the close. The SPX then made it all the way to 1554.66 before dipping into the close.
 
As I mentioned above, the market seemed to be forming a nested inverted corrective wave from the 1564.86 high. These waves can be very powerful, and that is what unfolded today. These waves require many waves to complete near the end of the formation, as four degrees of waves need to form before the wave has completed. Taking a closer look at the choppy trading shortly after the opening gap down, reveals how these waves were completed.
There are too many waves to delineate on the 3 Minute chart, so I expanded to a 1 Minute chart for demonstration purposes. The highest degree wave is in blue, then light purple, green and deep purple. I will explain this wave inside out, meaning I will start with the lowest degree wave, and end with the highest. This shows how the waves are connected.
The lowest degree wave began at yesterday’s 1552.52 low, and formed 1552.52-1560.26-1539.80-1541.54-1541.42-1544.12, and had a model value of .9999. The next degree wave started at the 1562.60 high, with Wave 1 completing at 1552.52, and Wave 2 completing at 1544.12, the termination point of the lesser degree sequence. This sequence was 1562.60-1552.52-1544.12-1540.64-1542.38-1539.50, with a model value of .999998. The next degree wave followed the same pattern, and went 1549.80-1562.60-1539.50-1541.82-1539.86-1542.23. The model value for this sequence was .9962. The final sequence from the 1564.86 then completed as1564.86-1549.80-1542.23-1541.16-1541.68-1540.29, and a model value of .9962.
From the completion of that wave at 1540.29, the SPX then completed a 5 Wave sequence to 1554.66 that contained an inverted corrective Wave 4. The main sequence consisted of 1540.29-1545.01-1542.39-1548.10-1547.55-1554.66, and a model value of .9988. The inverted corrective Wave 4 started at 1548.10, and formed 1548.10-1545.61-1547.17-1544.19-1549.76-1547.55. This sequence had a model value of .9948.
 
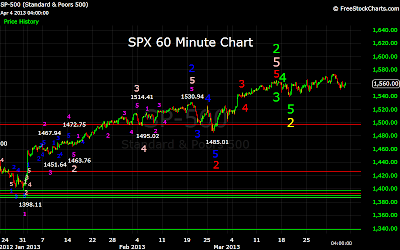
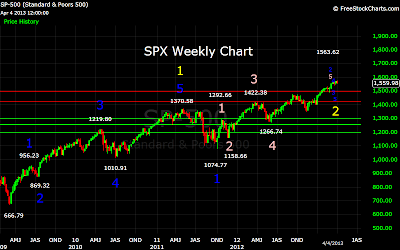
Looking at the larger picture, the market has completed 3 Waves from 666.79, 666.79-1370.58-1538.57-1564.86. It is possible that from that point waves 4, and 5 also formed, with a move below 1538.57 confirming that. With the nested inverted corrective wave completing today, and holding above 1538.57, the more intriguing possibility is that 1540.29 marks the end of Wave 4 from 667, with Wave 5 now underway. Further evidence of this count is the fact that nested inverted corrective waves normally indicate trend reversal points, and the Waves 1, 3, and 5 from 1540.29, are expanding. Normally at the end of a wave structure, the waves will contract, much as they are with the larger wave structure from 667.
Given the structure already completed, Wave 5 would have an upper limit of 1589. More accurately, a termination point above 1589 falls below my correlation threshold for the points (666.79, 1370.58), (1538.57, 1564.86), (1540.29, X), where X is the termination point of Wave 5.
Thank you.


Thursday, April 4, 2013

Thursday's Market 04/04/2013


Although my analysis on Tuesday concerning Wednesday’s possible market action seems to have been prescient, and I certainly hate to be the one to rain on my own parade, I believe it is more important to get things right, than to be right.

The market followed one of my scenarios quite precisely, but also left a number of questions. As I noted yesterday, the wave shape looks quite odd, and given my count on the 3 Minute chart as of EOD Tuesday, the decline from 1573.66 to 1549.80 looks, and counts, best as a single 5 Wave sequence. I will address this in more detail shortly, but first a review of today’s action.

 
This morning the market continued the rally it began yesterday afternoon, rising to 1562.60. This completed a 5 Wave sequence from 1549.80 with 1549.80-1555.80-1557.34-1560.88-1559.80-1562.60, and a model value of .9999. This wave contained an inverted corrective Wave 2, forming 1555.80-1553.68-1556.17-1554.60-1557.56-1557.34, which has a model value of .9981.
From there, the SPX formed a simple 5 Wave sequence as 1562.60-1552.71-1560.40-1553.83-1556.18-1552.52, this sequence has a model value of .9955. After reaching the 1552.52 low, the market rose again, but failed to reach a new high for the day. This sequence went 1552.52-1554.91-1556.19-1559.42-1556.66-1560.26, and also contained an inverted corrective Wave2. The main sequence had a model value of .9981, and Wave 2 traced out 1554.91-1553.88-1557.77-1556.80-1557.19-1556.19. This sequence had a model value of .99996.
 
Today’s market had the feel of a consolidation day following Wednesday’s big decline. With no clear trend emerging today, the question of where the market goes next remains, which leads back to the first part of this post. One other thing that has bothered me has been the failure of a larger 5 Wave sequence to emerge from the 1538.57 low. There are not usually this many peaks and valleys without some sequence completing. I spent a good deal of time today reviewing the move from that point, and concentrated on the move from 1546.22 to 1573.66. After reviewing that part of the chart, one alteration clears things up a bit. Between 1551.90 and 1570.57 there is a peak visible at 1568.30. It is most likely that a 5 Wave sequence from 1551.90 completed there, and then formed a semi-inverted corrective wave from 1568.30 to 1558.47. This count can be seen in parentheses on the 15 Minute chart. A 5 wave sequence from 1546.22 then emerges as 1546.22-1563.95-1551.90-1568.30-1558.47-1573.66. This sequence has a model value of .9997, and completes at the peak.
If this count is correct, and I believe it is, the first four points from 1538.57 are most likely a series of Wave 1’s. This would indicate a further move to the upside is close at hand. Since several counts are still possible, and going into each one in detail is not helpful. What is helpful at this point is to watch important market levels that will indicate the next market move.
The first level to watch is still the 1565.50 level. A 5 Wave sequence from 1538.57 could still terminate at this point, and the market would then see another move down, which will hold above 1538.57, and one final move higher to a marginal new high.
If the market moves above 1565.50, the nested inverted corrective wave that I have favored for awhile would be the most likely outcome. This would indicate a substantial move to the upside
To the downside, 1547 is the point to watch. The market could complete an inverted corrective wave from 1561.56 at this point. If an inverted corrective wave does complete at this point, I would anticipate two moves higher similar in size to the 1538.57 to 1561.56 advance, separated by a corrective Wave 4. This would put the market in the 1580-1600 range.
If the market moves below 1547, a larger move to the downside has most likely started. If the market follows that up with a move below 1538, we could move substantially lower.
Thank you.


Wednesday, April 3, 2013

Wednesday's Market 04/03/2013


Yesterday I wrote this:

“The second scenario would be slightly more bearish. If the market moves slightly lower, between 1560.40, and 1562.90, it is possible that an inverted corrective Wave 2 from 1563.95 has completed. From there, a rise to 1564.70-1565.40 could complete a 5 Wave sequence from 1538.57, and Wave 3 from 666.79. I would then expect a correction, which will hold above 1538.57, followed by one more wave moving above 1565. That would complete a 5 Wave sequence from 666.79 and portend a more severe correction.”

 
After a slightly higher open to 1571.47, the market began to pull back. Soon the SPX found itself at 1562.85. This was within the first range mentioned above. The high from that point was 1564.86. Again, within the range mentioned above. The market then quickly fell below the previous low of 1562.85, and it was down from there, with only feeble rally attempts until it reached 1552. From there the market rallied to 1537 before falling once again. Soon the market hit the low of the day at 1549.80, and then rallied slightly into the close.
Given the narrow ranges that this wave had to fall into, I have to say I was a bit surprised when the SPX actually moved exactly within those ranges. Admittedly, the wave itself is a bit odd looking, but at the moment my best interpretation is that SPX completed a 5 Wave sequence today from 1538.37 at 1564.86, and Wave 3 from 666.79.
 
I will break down the entire wave structure over the weekend, but for now the main sequence turned out to be 1538.57-1561.56-1545.90-1564.91-1546.22-1564.86, and a model value of .9975.
From the 1564.86 high, the market then completed a 5 Wave sequence down 1549.80. This wave again contained an inverted corrective Wave 2, and breaks down as 1564.86-1562.62-1557.36-1553.85-1554.54-1549.80. This sequence gives a model value of .9978.
With Wave 3 from 666.79 most likely completed, I would expect Wave 4 down, followed by a Wave 5 higher to ensue. Wave 4 may have completed today at 1549.80, but could move lower. This wave needs only to hold above the 1538.57 low. Wave 5 will most likely be quick. If Wave 4 did end today Wave 5 should reach 1567, but go as high as 1591. I will be looking for a 5 Wave move higher, and then a break below 1549.80. A break below 1538.57 at this point would mean the sequence from 666.79 has completed.
Thank you.