Tuesday, February 27, 2024

Tuesday Update 02/27/2024

 The markets traded within a narrow band again today, consolidating the gains from late last week, and awaiting some potentially market moving economic data due out later this week. SPY did mange an opening gap higher, reaching 506.74, but immediately reversed direction and headed lower. It fell to 505.53 before bouncing back to 506.58. This would define the trading range that lasted until just before noon. At that point SPY breached the lower end of the range, and drifted under 505 to 504.75 just after 1:00. That marked the low of the day as SPY then rallied through the afternoon up to 507.16, and closed at 506.93.


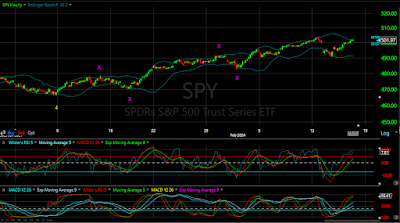
Today's action did not have a material affect on our count. As described yesterday, SPY is now in Wave 5 of Wave 5 from the October 2022 low.


SPY completed Wave 1 of this 5th wave this past Friday at 510.13. The RSI(5) did turn up from an oversold condition, and the MACD momentum appears poised to move higher. This could indicate we are nearing, or have reached the end of this corrective phase. However, there is the possibility that we could see another move lower, in A - B - C fashion, from the Wave 1 high. This would likely form the first three waves of an inverted corrective wave, with SPY then moving higher.

Our target remains the same for this final wave, with a minimum of 517, and with the shorter term count targeting above 537. 

As readers of this blog know, I have been publishing my 537 target for some time. That would equate to ~ 5370 on the S&P. Glad to see Barklays concurs. 

https://finance.yahoo.com/video/barclays-raises-p-500-target-212917531.html


Monday, February 26, 2024

Monday's Update 02/26/2024

 The market opened marginally higher today, coming off the strong gains of late last week. SPY drifted up to 508.66 in early trading before reversing course and moving lower. That move lasted into late morning, and SPY was down to 507.01 just before 11:30, A small rally attempt lasted until after noon, and SPY was back to 507.88. Another move lower followed, with SPY testing the 506 level, dropping to 506.02 before trying to move higher once again, The rally failed at 507.29, and SPY moved back towards the low of the day. SPY did make a new low for the day just before close, dropping to 505.86, before closing at 505.99.


Our current count remains the same. The late rally last week appears to be the start of Wave 5 of Wave 5 from the October 2022 low of 348.11. It looks as though this Wave 5 is subdividing into a 5 wave sequence with Friday's high marking the completion of Wave 1. Our minimum target for the completion of this final wave is 517, with the smaller magnitude sequence pointing to a high above 337. 


Saturday, February 24, 2024

Friday Update 02/23/2024

 The rally following NVDA's earnings report continued into this morning, as we saw another opening gap higher on SPY, propelling it briefly above 510. It hit a high of 510.12 before turning lower, trading between 509 and 510 before breaking lower to the 507 level. Two rally attempts failed at that same 509 level that had earlier offered support. The third attempt only made it to 508.76 before turning lower once again to close at 507.85.


We continue to follow this Wave 5 from the January 5,2024 Wave 4 low of 466.43. We had a minimum target of 517 for this final wave, which we are approaching. Our current structure for this wave gives a slightly higher target, with a minimum of 537.


We will be closely monitoring this final wave for any deviations from our current count.

Help support this page.


Thursday, February 22, 2024

Thursday Update 02/22/2024

 The late afternoon rally on Wednesday afternoon certainly foreshadowed what was to occur this morning. All eyes had been on the NVDA earning report, which was due out after the close. NVDA has been on an incredible tear since early January, rising more than 50%. Expectations were high, and the odds of a disappointing report seemed just as high. But NVDA did not disappoint, and the run continued today.

No one who read our report on Wednesday should have been surprised, as we saw NVDA currently in a 5th wave, with a target above 1380. On the heals of that earnings beat, analysts have been falling over each other trying to raise price estimates. One has a high of 1200. Nice to see they are following my lead.

Wednesday, February 21, 2024

Wednesday Update 02/21/2024

 The day started with a small gap to the downside, with SPY dropping just under the 495 level to 494.91. It seemed to be an indecisive trading day, with NVDA earnings due after the bell. SPY traded in a narrow range for most of the day, staying between 494 - 495. with only slight breakouts on either side. SPY drifted down to 493.56 late in the day, marking the low of the day. That seemed to spark a rally, as a strong move in the final 45 minutes took SPY to 497.37, and closed at 497.21.


We had been looking for SPY to make a move to 490 - 491 to complete an inverted corrective Wave 4, but we never made it down to that level. It is still possible that it will reach that level, but the technical indicators suggest we have seen the bottom of this short term wave. It is likely that we have some more work to the upside before we see one more move lower for the completion of Wave 4. Our overall count remains the same, with a target for SPY above 517, and most likely somewhere near 530.

I posted my Long Term Count for NVDA yesterday on my substack. I will be using that to post counts on NVDA and some other stocks. Be sure to subscribe so you won't miss important updates. In case you missed it. here is the post:

Arguably the most anticipated event of this trading week will be the NVDA earnings, scheduled for Wednesday after close. The historic run in this stock has been well documented over the past year and a half, with the AI frenzy fueling an incredible run over that period. In October 2022 NVDA traded as low as $108.13, and recently traded as high as $746.11. Nearly a seven-fold increase in less than 16 months.

This kind of run has not been unprecedented for NVDA. This run was preceded by an eleven-fold increase from January 2019 to November 2021 when NVDA went from $31.11 to $346.47.

In this post I will outline my long-term count for NVDA. This chart begins with the inception of NVDA and brings us to the current outlook.


The first wave of note terminated in January 2002, and had the high at $6.06. A steep correction followed, bringing NVDA back to $0.60. As you can see, I have these labeled as Wave 1, and Wave a. A multi-year bull run followed after that, with NVDA running up to $9.92 by October 2007. Another correction followed, with NVDA dropping to $1.44. You will notice on the chart that the two corrections so far appear as nearly the same magnitude on the chart. My interpretation is that NVDA started forming an inverted corrective wave from the Wave 1 high, and you see the two waves are labeled as Wave b, and Wave c. In this structure, a 5 wave “corrective” wave occurs, which carries the equity in the direction of the initial impulse Wave 1. It is deemed a corrective wave since the corrective waves a, c, and e are related instead of the impulsive waves, and “inverted” since this wave moves in the direction of the original impulse wave as opposed to a normal corrective wave which would move in the opposite direction.

With the first three waves of the inverted corrective wave complete as a, b, c, the expectation would be to see Wave d move in the impulsive direction, and Wave e to then complete in relation to waves a, and c. We can see that is exactly what happened, as Wave d was extremely powerful, lasting 13 years, and taking NVDA up to a high of $346.47. Also notice the structure of this wave. A Wave 1, followed by an inverted corrective Wave 2, with Wave d being the most powerful wave, and the corrective waves a, c, and e being similar in magnitude. Waves 1, 3, and 5 then complete in relation to each other, which constitutes a completed wave.

Once Wave d completed, Wave e followed, completing in relation to Waves a and c. Since then NVDA has completed Waves 3, and 4, and is now in Wave 5. Again you will notice the resemblance of Waves 3, 4, and 5 (in green) from the lower magnitude Wave d. We often see this type of relationship between different magnitude waves.

With 4 waves completed from the 1999 low, we can project where Wave 5 will terminate. As I said, waves 1, 3, and 5 form a specific relationship, so we can use that to project the Wave 5 high. If the current structure proves correct, Wave 5 will complete above $1365.00.

This information is provided for educational purpose only, and in no way should be taken as investment advice. Trading around earnings can be extremely volatile, and the long term count is not intended to provide directional bias around those earnings.    


Here is an update for today:

From the final Wave 4 on the long term chart, we can follow the development of Wave 5. Wave 1 completed at 505.48, and was followed by what we are calling at the moment Wave a of an inverted corrective wave. Wave b of that inverted corrective wave was extensive, and carried NVDA to an all time high of 746.11. The correction from there has been Wave c, and on shorter time period charts there are indications that that wave has completed. If so, we should see a resumption of the uptrend to complete Wave d.


NVDA Earnings - 5WaveModel Long-Term Count


Arguably the most anticipated event of this trading week will be the NVDA earnings, scheduled for Wednesday after close. The historic run in this stock has been well documented over the past year and a half, with the AI frenzy fueling an incredible run over that period. In October 2022 NVDA traded as low as $108.13, and recently traded as high as $746.11. Nearly a seven-fold increase in less than 16 months.

This kind of run has not been unprecedented for NVDA. This run was preceded by an eleven-fold increase from January 2019 to November 2021 when NVDA went from $31.11 to $346.47.

In this post I will outline my long-term count for NVDA. This chart begins with the inception of NVDA and brings us to the current outlook.

Continue Reading

Tuesday, February 20, 2024

Tuesday Update 02/20/2024

 The markets started the week on a bearish note after the long weekend. A gap down opened the week, as SPY fell to 497.60. The markets continued to work their way lower through the early morning, with SPY eventually falling to 495.75 just after 10:30. SPY tried to rally from there, but only managed to make it 497.30 just after 11:00. Another round of selling took the markets lower during the rest of the morning, and into early afternoon. Shortly after 12:30, SPY fell to it's low of the day at 494.45. From there the markets again tried to stage a rally, and SPY moved higher through most of the afternoon. Soon after 3:00, SPY was sitting at 496.88, but then a sharp drop found it testing the 495 level once again. SPY did rally in the final minutes, fighting back to 496.83 before closing at 496.76.


In our weekend update we detailed our current count, with a focus on the current wave from the January 5,2024 low of 466.43. It is our contention that this is Wave 5 from the October 2022 low of 348.11. We project this wave to complete at a minimum of 517, with a working target of 530. Shorter term we are still looking for a low of 490 - 491. We don't rule out a drop somewhat lower, near 480, but 477 is the lower limit for the current count. We would then expect a move taking SPY above 517.


Sunday, February 18, 2024

Weekend Update 02/18/2024

 The week started on a positive note, as SPY opened higher on Monday, getting as high as 503.50 during the morning. It gave up those gains during the afternoon, dropping near the 500 level before closing slightly below Friday's close. A disappointing CPI report sent the market lower on Tuesday, breaking through the 500 level, and back down to the 490 level. The remainder of the week was spent recovering from that drop, with SPY getting back above 500 on Thursday and Friday, but closing the week just below that level at 499.51.


Friday, February 16, 2024

Friday Update 02/16/2024

 The market opened flat this morning, but quickly made it's way lower in early morning trading. Just after 10:00 SPY fell to 498.75, and once again testing the 500 level. It did find support at that level, and by noon it had rallied to 502.46. SPY drifted lower over the next hour and a half, falling back to test the 500 level once again at 500.74. Another rally off that support took SPY to a new high for the day at 502.87, just after 2:00. That rally quickly evaporated, and Spy soon found itself bouncing around that 500 level. This time that level failed to hold, with SPY dropping to 498.98 before closing just above that at 499.51.


Thursday, February 15, 2024

Thursday Update 02/15/2024

 The rally off Tuesday afternoon's low continued today, as SPY opened to the upside, and continued higher throughout the day. SPY opened with a small gap to the upside, and zeroed in on the 500 level first reached last Friday. Within the first half hour SPY did regain that level, if only momentarily. After hitting a high of 500.38 SPY turned lower. and fell to 498.80 just after 11:00, closing the opening gap. The "buy the dip" mentally took over once again, and SPY moved above 500 once again by 1:00. After one more dip just below the 500 level, SPY moved higher through the rest of the afternoon, hitting a high of 502.20. SPY then fell back towards the 501 area before rallying near the close, and ending the session at 502.01, just off the high of the day.


Our target remains the 517 level as the completion of a 5 wave sequence from the October 2022 lows.


We have been following the wave structure from the Wave 4 low which terminated on January 5,2024.


There seems to be 4 waves completed thus far from that low, which I've identified with the purple X's. If this completes as a simple 5 wave structure, the target to complete this wave, and therefore the entire sequence from the October 2022 low would be above 522, right in line with our longer term target. This wave could still take several forms from here, but we would expect that 517 area to remain the target level.

On the 15 Minute chart we can follow the structure from the last purple X above.


Once again we see four completed waves, denoted by the green X's. From the last wave we can see a Wave 1 to the upside, followed by an inverted corrective Wave 2. If this completes as a simple 5 wave structure, it would terminate near 504. This would not be sufficient to complete the higher wave sequence on the Hourly chart. If SPY does move significantly above 504, we could expect a more complicated wave structure, but would continue to target the 517 level. If 504 does hold here, we would expect another pullback of 9-10 points before resuming the uptrend.

Wednesday, February 14, 2024

Wednesday Update 2/14/2024

 Most of Tuesday's action was decidedly bearish. After dropping nearly 11 points from Monday's close, SPY staged a late day rally into the close. That rally saw some follow through at the open, as SPY gapped up to 497.30. After a small pause, it continued up to a high of 497.99. At that point the market turned lower, and SPY dropped to 494.40, nearly closing the opening gap. The rally then continued through the afternoon as SPY made a run at the 500 level, moving up to 499.07 before settling back to close at 498.57.


We continue to target the 517 range for the top of this 5 wave sequence from the October 13, 2022 low of 348.11.


Visit our other Blogs here:

Tuesday, February 13, 2024

Tuesday Update 2/13/2024

 A disappointing CPI report sent the indices markedly lower at the open, with SPY dropping under 495 to 493.95. After drifting lower still to 493.22, SPY tried to rally back towards 495. It did slightly move above that level into the noon hour, but saw more pressure through the afternoon, falling to a new low for the day at 490.72. That sparked a late day rally that took SPY back above 494 and closed at 494.08.


In the Weekend Update I outlined a scenario that would take SPY above 517 before we saw a correction. If you recall, that scenario featured a wave sequence from October 13, 2022 low of 348.11.


In this scenario SPY is in Wave 5 of a 5 wave sequence that should terminate above 517. 


Sunday, February 11, 2024

Weekend Update 02/11/2024

 This week saw a continuation of the rally that has seemingly been non-stop since the October 27,2023 low of 409.21. Monday saw an early pullback of about 4 points from Friday's close, but reversed off the 490.23 low, closing down only slightly. Tuesday saw some continued consolidation as SPY traded in a narrow range between 492 and 495. Wednesday saw the SPY eclipsing Friday's close, with a strong gap up, and continued strength during the remainder of the day that brought SPY within shouting distance of the 500 level. Thursday was another narrow range day, as SPY consolidated just under the 500 level. SPY moved higher again on Friday, and finally did rise above the seemingly inevitable 500 mark. That level then provided support, and SPY closed out the week at 501.20.


On the Daily Chart we can see the 5 wave structure taking shape off the October 13,2022 low of 348.11. The initial rise off the low was choppy, but did complete a 5 wave sequence higher into the February 418.31 high. SPY pulled back into March, but then showed a stronger leg up into July. The market then declined into the end of October, and we can see this as the completion of an inverted corrective wave from the 418.31 high. This would mean that 2 waves of the 5 waves completed at that point. Wave 3 looks to have completed in December, with the slight pullback at the beginning of this year completing Wave 4.


With four waves completed, we can make some projections for the completion of this wave. Given the current count, Wave 5 should complete between 517, and 556. We will be keeping an eye on the 15 and 60 Minute charts to help narrow down that range as we move closer. We will also be looking at some projections for how deep the correction may be.