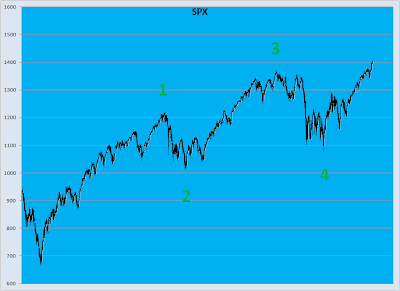
After completing a five wave corrective sequence on Monday, the market moved higher into Wednesday, temporarily topping out at 1399.42. Most of Wednesday was spent developing another corrective sequence, which was completed by that afternoon. From that point the market moved higher once again, ending the week at 1405.24. We discussed our very short term outlook in Friday’s post, our expectations being that the market should bounce between 1400 and 1407, before making a short term low at 1394-1401. This would complete a 5 wave inverted corrective sequence from the 1366.69 low made on Monday. That low would be labeled Wave 2, with all waves from Wave 1 being relabeled as waves of one lesser degree. At this point, a move below the 1390 level would be considered negative, and could signal the end of the uptrend. At the very least we would then expect a further move to the downside.
With that low in place, we expect the market to then move higher, our target still being 1414-1421. That would complete a 5 wave sequence from the 1340.03 low, the 1074.77 low from October 2011, and the 666.79 low of March 2009. The market should then begin a 5 wave corrective sequence.
We believe the high at 1414-1421 will be a significant top. The ensuing corrective sequence could play out in a number of ways. There is a high probability that a Wave 2 such as this will be, will become a complex wave, either an inverted, or semi-inverted corrective sequence. Each of those scenarios would permit the market to move above the 1414-1421 level after a Wave 1 move down. We will discuss the possible scenarios in future posts.
Our long term outlook is still bullish. Although it may turn out to be, we do not believe this is part of a larger corrective sequence from the all time highs.
As many of you are practitioners of Elliot Wave in one incarnation or another we would like to at this point re-iterate that we are in no way trying to represent these as Elliot Wave counts. Our model is not rooted in Elliot Wave Theory, and none of our work is based on any Elliot Wave tenets. Our model is strictly based on a specific mathematical relationship between waves that manifests itself at the termination point of any given five wave sequence. Our model is designed to identify when a wave sequence is ending, and when a trend reversal is likely to occur. Our model does not determine the wave degree, nor does it give any indication as to where the next five wave sequence will terminate.
Having said that, we do not believe that the two are necessarily mutually exclusive, but rather two approaches to trying to understand one underlying phenomenon. During wave construction Elliot Wave, and the 5 Wave Model will exhibit much different wave counts. We have noticed, however, that the two do converge at important turning points. For Elliot Wave counts we will defer to Tony Caldaro, http://caldaro.wordpress.com/author/oewcaldaro/. He has elevated Elliot Wave from an art to a science, more aligned with our thought process. Tony’s track record speaks for itself, and we have great respect for the work he has done.
At the moment our two outlooks on the market seem quite different, but it is entirely possible for oncoming waves to unfold in a manner that would satisfy both approaches. The real value may be in examining the future implications of each, perhaps giving a clearer understanding of what may be in store, and giving a means of recognizing trend reversal points as they occur.
Take, for example, our current outlooks. Both are indicating an imminent trend change, the only difference being the degree of that trend change. Our model allows for both an inverted, and a semi-inverted, corrective eave. Either of these could result in a wave structure that conforms to both Tony’s OEW count, and our 5 Wave Model. However this wave progresses, we trust that our model will identify the key turning points.


No comments:
Post a Comment