Monday, March 6, 2023

Monday Market Update 03/06/2023

 The market opened stronger today, continuing the late week rally that sprung from last Thursday's opening low. SPY gapped up, opening at 405.08, and remained strong through the early morning. The stock reached 407.45 shortly before 11:30. That proved to be the high of the day, with SPY drifting lower through the afternoon. With half an hour of trading left, SPY closed that opening gap. After hitting a low of 404.03, it once again pushed towards 405.00 into the close.

SPY remained below the critical 411 level I had mentioned over the weekend, so the two counts I reviewed thoroughly in the Weekend Update remain in play. The market is now at an inflection point, and how it reacts at this level will be pivotal.

Technically, SPY came off the overbought levels of the morning to finish the day in oversold territory on the 15 Minute chart. There is also a small positive divergence near the end of the day. 


Since I have been also following TSLA recently, I have decided to include that analysis here also.

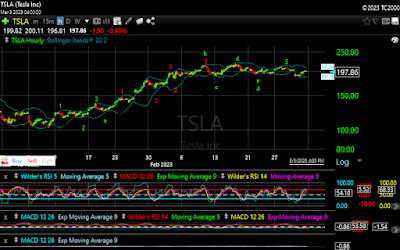
Following the sell-off last Thursday that brought TSLA to 186.01, the stock rallied back to 200.48 on Friday. It was unable to hold the 200 level, and saw a bit of a sell-off into today. I continue to count the completion of a 5 wave sequence from 101.81 at 209.41. The following move to 186.01 could possibly be a correction low. 

Today's drop took TSLA into oversold territory on both the 15 Minute and Hourly charts, with a positive divergence on the 15 minute chart, which would be a good place to rally off of. The important levels to watch are the 186.01 low, and the 209.41 high.


Help fund further research.


Stocks to Watch:

Here are a couple of stocks I will be watching on Tuesday.

AMGN:

AMGN gave a short term buy signal today. These signals usually last 1-3 days.


BIDU:

BIDU seems set up for a short term buy signal. While the signal has not been given yet, a higher open would likely trigger one.


PDD:

PDD is in the same position as BIDU. No signal yet, but a move higher from here would likely trigger one.


Weekend Market Update 03/05/2023

 For some time I have targeted the 396 level, to be followed by a move the 406-411. SPY spent most of the past two weeks bouncing around the 402-392 level. On Friday we did see SPY finally break above that 402 level. When last I posted, my current count from the 418.31 high was this:


SPY had moved slightly below the level at which I was expecting to see a move higher. The action from the 21st to the 24th was choppy, and difficult to follow at times. Now that it has resolved itself I can revisit this count, and see where we are. After reviewing the count further, I was able to clarify some of the action, and show a slightly revised count here:


The major revision involved seeing Wave E(Purple) as a more extended wave that ended on the 23rd at 402.20. Waves 3,4 and 5(Purple) then completed on the next move lower to 396.25, completing Wave D(Green). From there we can walk through the rest of the count. Wave 1 (Green) completed at 408.51. Wave 2(Green) then completed as an inverted corrective wave, which broke down into A-B-C-D-E, giving us 408.51 - 413.65 - 409.47 - 414.00 - 396.25 - 401.62. Analyzing the sequence (418.51, 413.65), (409.47, 414.00), (396.25, 401.62) gives an R^2 value of .99837.

We can now see that the Green 5 wave sequence completes as 415.05 - 408.51 - 401.62 - 393.64 - 401.29 - 392.33. (415.05, 408.51), (401.62, 393.64), (401.29, 392.33), gives an R^2 value of .99731.

The completion of that sequence is Wave D(Red). Given the four competed waves of this sequence, A-B-C-D(Red), we can now calculate the range in which Wave E(Red should complete. SPY has already entered into that range, with the maximum of that range being 411.19. That level may be an important one, as I will explain.

The above count calls for a high between the the current price levels and 411.19, to be followed by three waves down to complete the 5 wave sequence from the 418.31 high. There is an intriguing alternate count which I will discuss now.

In the current count Wave B(Red) completed on the 10th at 405.01. From that point there are 5 counted waves to the 414.00 high on the 15th. I am currently counting these as Wave C(Red), Wave 1(Green), and Waves A-B-C(Green). This still seems to be the best count, but there is an important alternate count to consider. I currently show the first wave from Wave B(Red) completing at 415.05. A case could be made for that wave having completed slightly earlier, at 412.97, followed by a complex corrective wave to 408.51. Taking that as the high gives the sequence from 405.01 as 405.01 - 412.97 - 408.51 - 413.70 - 409.47 - 414.00. (405.01, 412.97), (408.51, 413.70), (409.47, 414.00), with an R^2 value of .99343. That would put the Wave C(Red) endpoint at 414.00. 


This shows the alternate count using 414.00 as Wave C(Red). I filled in the remainder of the alternate count with "?". Continuing with that count we see that Wave 2(Red) completes as 407.57 - 416.49 - 405.01 - 414.00 - 396.25 - 401.62. (407.57, 416.49), (405.01, 414.00), (396.25, 401.62) gives us an R^2 value of .99636. The entire 5 wave sequence from 418.31 can then be seen as 418.31 - 407.57 - 401.62 - 393.64 - 401.29 - 392.33. (418.31, 407.57), (401.62, 393.64), (401.29, 392.33) gives an R^2 value of .99632.

It seems that SPY is at an inflection point here, which makes the current price levels extremely important. A move above the 411.19 upper limit I discussed earlier would likely make the alternate count I have discussed the correct count. 

There is some further evidence of a bottom having been put in at 392.33. In my TSLA update yesterday I discussed one method for determining a likely limit for a corrective wave using the previous low, the correction low, and the last two high of the previous wave. The 392.33 low would satisfy that method. SPY has also given a technical buy signal on the daily chart. We will see if those hold over the coming days.

TSLA Weekend Update

Help fund further research.

Sunday, March 5, 2023

TSLA Weekend Update 03/04/2023

 In Tuesday's Update, my analysis was that TSLA had completed 5 waves of a 5 wave sequence from 101.81, and set a target between 212-234. I gave 191.78 as a point at which that analysis would be invalidated. Wednesday saw TSLA move lower from the opening, falling to a low of 198.52. During the afternoon TSLA moved mostly sideways, with a slight upward bias, rising to 203.42, before closing at 202.75. Technically TSLA hit oversold at the open on the 15 minute chart, and the sideways move into the close worked off that oversold condition, and worked into overbought territory, setting up a lower low, lower high situation going into Thursday.

Given that set-up, TSLA gapped down on Thursday, dropping to 186.01, and moving below the critical 191.78 level necessitating a revision to my analysis. Once again TSLA moved mostly sideways the remainder of the day, rallying slightly off the low, and then falling again into the afternoon. This action created a short term buy signal at 3:45 on my technical charts, with TSLA at 191.07. 

TSLA gapped up on Friday, opening at 194.61, and continuing to rise through most of the day. My short term technical signals gave a cover at 199.13. TSLA topped at 200.48, before giving back a little ground into the close.

With TSLA moving below the 191.78 level, we will need to review our analysis. I will begin where I left off on Tuesday. 


Here is my count from Tuesday. As you can see, I had TSLA in Wave 3 of Wave 5 from 101.81, with a target of 212-234. Obviously this was wrong. One thing I had noticed on Tuesday, but had discounted, was the initial move off the Wave 4(Green) low on the 22nd. If that initial move were Waves 1,2, and 3, instead of Wave 1, the wave from Wave 2, the move following the low marked Wave 2(Red) on the 28th to the upper Bollinger Band would complete a 5 wave sequence from that Wave 4 low. This would look like 191.78 - 201.99 - 196.82 - 205.14 - 203.75 - 209.41. Taking those as points, and applying a linear regression, we get (191.78, 201.99), (196.82, 205.14), (203.75, 209.41), with an R^2 value of .99998. The move from Wave 4 would now look like this:


As you can now see, TSLA completed a 5 wave sequence from the 191.78 Wave 4 low. I had originally discounted this for two reasons. The first being that it would require a wave 5 failure, as it would not complete at the high, which is rare, and the second being that it did not meet the requirements for Wave 5. So now we must re-evaluate the count from the 101.81 low.


This had been my count going into Wednesday. For the sake of clarity I removed the smaller waves from Wave 4, and marked the end of the 5 wave sequence from that point with "X". The initial move is notated by Wave 1. Following the green A-B-C-D-E, will lead you through what I had counted a an inverted corrective Wave 2. This took the form (123.52. 115.60), (136.68, 124.31), (214.00, 187.61), with an R^2 value of .9943. Normally the first instance of sequence exceeding the R^2>.99 threshold denotes the end of a sequence. However, that is not always the case. If one looks at the sequence B-C-D-E-3-4, one would notice that this also forms a sequence with an R^2 value over .99. Namely (136.68, 124.31), (214.00, 187.61), (217.65, 191.78), with an R^2 value of .99978. Changing A and C to 2 and 3 respectively, and following that with an inverted corrective Wave 4, results in this chart:


Now we can evaluate the sequence 1-2-3-4-X from 101.81. With Wave X terminating at 209.41, we have (101.81, 123.52), (115.60, 136.68), (191.78, 209.41) with an R^2 value of 1. Thus we have a 5 wave sequence from 101.81 completing at 209.41.


The decline from the 209.41 high formed a 5 wave sequence down to the subsequent 186.01 low as is seen here:


One method of creating a target range for a corrective wave is to look at a relationship between the origin of the previous wave, the subsequent corrective low, and two highs from the previous wave, normally the last two highs, as depicted here:


Using this method gives a range between 178-188 for the correction from the 209.41 high. Thursday's 186.01 low falls right into that range. While still too early to call that a low, it is quite possible.

Technically, TSLA is close to giving a buy signal on the 15 minute chart, but has not as of yet. On the 60 minute chart the stock has reached overbought, and on the Daily chart it is oversold, and close to giving a buy signal. The action over the next few days should give us some insight into short and longer term direction.