Thursday, February 23, 2023

Thursday Market Update 02/23/2023

 After finishing yesterday's down day in decidedly oversold territory, they market started with a bang today. A gap up opening took SPY to 402.20 within the first half hour. That initial enthusiasm soon faded, as SPY then tracked down below yesterday's low to 396.35 just after noon. After that the market regained it's footing and rallied back near the opening high to 401.62, before selling off slightly at the close. It fell back near the 400 level at 400.41 before closing at 400.64.


When the market opened higher above the 402 level, it looked like we were on our way to the 407 - 412 area I mentioned yesterday. But the decline below yesterday's low took care of that in a hurry. The start of this wave from 418.31 was choppy, and so several  counts are possible. One such count I outlined above, as the February 14-16 action can be counted as A-B-C of an inverted corrective wave. Today's opening move higher was Wave E and the decline then finished Wave D from the 14th. The conservative count from here still calls for a move to 406 - 411, followed by another move lower, probably below 396. 

A second count would call for a move back down to the 396 level from here, before commencing the rally to the 406 - 411 level. A third count points to today's low as being the completion of a 5 wave sequence from the 418.31 high.

The 402 area has proven to be a resistance area, and you will notice that many of these wave options see that as a significant point. The same can be said for the 396 level. The 406 - 411 level seems to be the next area of interest. If that level holds, a move down to 396 looks probable. A break above that level could point to today being the end of the 5 wave sequence.


Wednesday's Update

Contribute to further research.

Wednesday, February 22, 2023

TSLA Update 02/22/2021

 I was a little early on the Wave 4 low the other day. Today's low of 191.78 still keeps the count intact, with the only change being a slight change to the Wave 5 high. I would now set my target between 212 - 234.

Both the RSI and MACD look positive after today's action. 


Wednesday Market Update

Market Update 02/22/2023

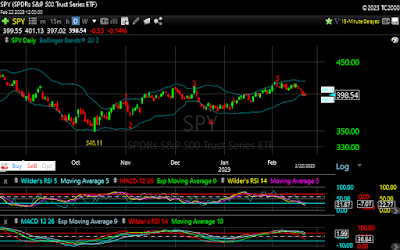
 Given the oversold conditions the market closed at on Tuesday, it would not have been unexpected for the market to attempt a rally this morning. Initially it did, as the market opened slightly higher to just above the 400 level. That was short-lived however, as the market soon resumed it's downward trajectory, falling once again below the 400 level to 397.62. Another, more sustained rally took hold from there, and the market enjoyed a steady rise to near the 401 level ahead of the Fed Minutes. The market swung higher and lower immediately following the release of those minutes, before again deciding on a downward path. SPY once again tested the 397 level right before the close, before rallying to close at 398.60.


Yesterday I mentioned the shorter time frame charts being noisy. Today's action seemed to clarify some of that, and while still noisy in spots, some things have come into clearer focus. Counting from the recent 418.31 high, I am counting the initial move down to 407.57 as Wave 1 of this move lower. The market then moved in sideways fashion to 416.49 - 405.01 - 415.05, which can be counted as Waves A - B - C of an inverted corrective wave. After that, the entire move down to today's low of 397.02 can be counted as a 5 wave sequence for Wave D.


In the short-term this count implies a move higher. Given the structure of the inverted corrective wave to this point, the Wave E target would be between 407 - 412. From that point we may see another move down. My work still shows a downside target somewhere below 396. For now I'll leave it there and follow this a wave at a time.

If you find value in this analysis, please consider a donation to help us continue our research.

TSLA Update