
Sunday, October 19, 2014
Thursday, October 16, 2014
Thursday's Market 10/16/2014
The SPX opened lower again this morning. After
falling to 1835.02, the index began to rally. It rose in choppy fashion to
1876.01 before falling back into the close.

The SPX, although opening lower, managed to hold
above the 1820.66 low. From that point the index looks to have completed a 5
wave sequence higher at 1876.01. The index looks to again be at a critical
point. With a 5 wave sequence today 1876.01, there is a danger of the SPX again
rolling over and continuing its slide. If this should happen there looks to be
support at around 1819. At this point I am still looking at 1820.66 as a longer
term low. My current count would have the SPX moving higher, with 1880 as a
likely resistance level. If the index moves up to that level 1865 would become
support.

Wednesday, October 15, 2014
Wednesday's Market 10/15/2014
It was a brutal day for the SPX, with the index
plunging at the open to 1837.22. After a brief attempt at a rally that brought
the SPX back to 1866.64, the index dropped once again, this time reaching a low
of 1820.66.

I will be the first to admit that I have not
tracked this decline very well, so I will proceed cautiously. The two scenarios
I outlined for the longer term outlook yesterday remain intact. Short term, the
SPX still looks to have completed a 5 wave sequence from 2019.26 last Friday at
1912.84. The quick choppy action from that point has been the problem for me.
After today’s action it looks like the SPX completed an inverted corrective
wave as 1935.56-1890.90-1912.02-1874.14-1898.71. So from 2019.26 the index
could have completed Wave A at 1912.84 and Wave B at 1898.71. The first drop
today may have been Wave C, the bounce to 1866.64 Wave D, and the final drop to
1820.66 as Wave E. This is supported to an extent by virtue of the SPX finally
making a higher short term high by moving above the 1866.64 Wave D this
afternoon. The move off the 1820.66 low also looks to be an incomplete wave,
suggesting further upside is possible.
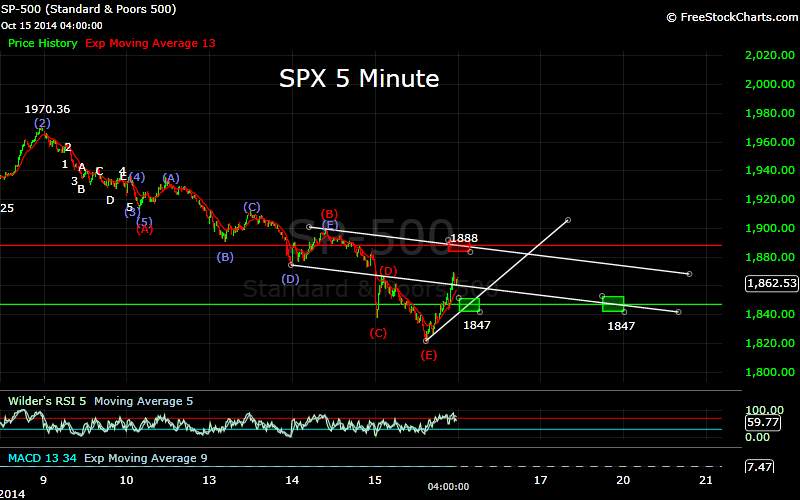
The short term wave structure suggests a move
higher to the 1888 level, with some indications that if this does occur, it
should happen early in the trading day. After that a pullback to 1847 seems
likely. Obviously if the SPX drops below the 1820.66 low this scenario would be
invalidated. Support is possible below 1810, but the next major support would
likely be the 1748 level.


Subscribe to:
Posts (Atom)