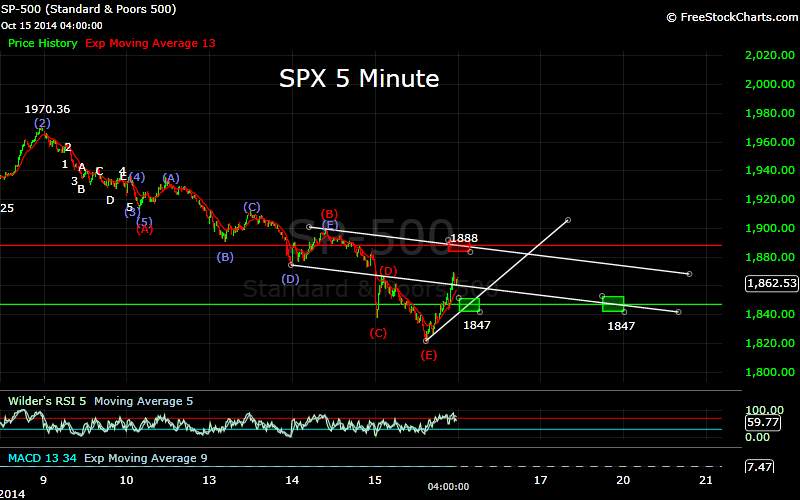
Last Friday the SPX fell to 1912.84 and completed
a 5 wave sequence from the 2019.26 high. I thought there was a good chance that
the index would rally from that point, but that turned out to be only the first
wave of a higher degree sequence from that high. The SPX appears to have
completed that sequence today at 1871.79. The first step in confirming this as
a low would be a move above the previous short term high of 1898.71 hit earlier
in the day.


I have been looking for this decline to complete
in one of three ways. One of those scenarios was made highly unlikely with the
drop below 1881, so I will briefly outline the other two. Looking at the weekly
chart I have identified 5 waves as having completed from the 666.79 low. The
initial move to 1219.80 is counted as Wave 1 in both scenarios. My current
count has the next waves as 2 and 3 at 1010.91 and 1370.58. The following
decline is labeled as Wave A of an ongoing corrective Wave 4. Wave B then
completed at 2019.26, putting the SPX currently in Wave C of 4. Given the
current wave structure, Wave 5, when it unfolds, is likely to be quite short.
Consequently the decline preceding Wave 5 also needs to be shallow. To
accomplish this, the current Wave c of 4 needs to be shorter than Wave A, which
was around 295 points, and Wave E of 4 will need to be shorter still. This
obviously still leaves some room to the downside, but with the SPX completing a
sequence, and the need for a shallow Wave E, it is possible that this is the
end of Wave C. Wave D should then carry the SPX to new highs, and be followed
by a Wave E decline to complete Wave 4. One more move to new highs would then
complete the sequence from 666.79. An EW equivalent count would be I-II-1-2-3-4-III-IV-V,
with the SPX currently in Wave 4. This is the same wave structure as the wave
from 1074.77 to 2019.26.
The second scenario is much more bearish in the
near term, but may turn out to be more bullish in the longer term. Again Wave 1
can be seen as the move from 666.79 to 1219.80. The entire move from that point
can be counted as an ongoing inverted corrective Wave 2 with Wave A completing
at 1010.91, Wave B at 1370.58, Wave C at 1074.77, and Wave D at 2019.26. The
SPX would then be currently in Wave E of 2. The minimum target for this wave
would be 1748, but would likely carry lower than that. This would then need to
be followed by Waves 3, 4, and 5. I had discounted this scenario for some time,
as until recently the need for this wave to exceed the 295 point decline of
Wave C would have taken the index below the 1370.58 high, which seemed unlikely.
The SPX however has now reached a level where that magnitude of decline is
plausible.