Thursday, October 10, 2013

Thursday's Market 10/10/2013

After testing the 1651 support level yesterday, and completing a 5 wave sequence to the downside from the 1729.86 high, the SPX rallied from that level, moving to 1662 during the afternoon. With a small pullback to finish the day on Wednesday, it looked like the market was set to rally. Rally it did today, gapping higher at the open, and reaching 1682 by mid-morning. It soon reached the 1685 resistance level, and then traded sideways until the last hour of trading. The SPX hit 1692.48, pulled back slightly, and then rose into the close.


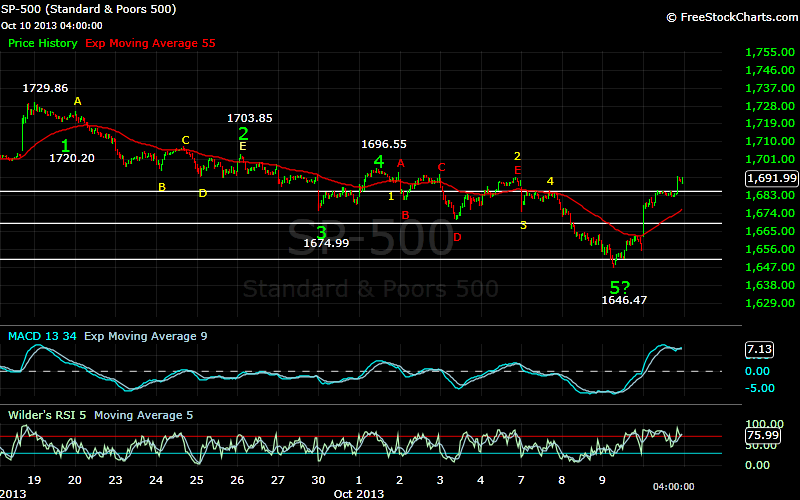
I had set an initial target near 1700 for this move to the upside, which the market has nearly reached. From the 1646.47 low yesterday, it looks like the SPX completed the first wave higher yesterday at 1662.47. It appears that the pullback yesterday afternoon may have been wave 2, with wave 3 occurring this morning as the index rose to 1685.43. The sideways actions followed by the rise to 1692.48, and then the pullback to 1688.91 looks to then have completed an inverted corrective wave 4. This means a wave 5 would be expected next. Given the above scenario, the optimal target for wave 5 would be 1745. Some of you may recall 1745 as my target for the last uptrend. That time the market fell short of the target, but it is interesting how numbers seem to re-appear time after time. We’ll see if the SPX makes it to that level this time.

Since my longer term count has changed, the 1776 minimal target for the completion of the sequence from 1074.77 no longer applies. However, after the 1745 target I am expecting one more move higher, so we may still see that number.

Short term resistance is at 1703, and then 1723. Support remains at 1685, 1668, and then 1651.


Wednesday, October 9, 2013

Wednesday's Market 10/09/2013

The SPX opened slightly higher today, but quickly gave back those gains to move lower. Yesterday I said that a 5 wave sequence from the 1730 may have ended, but could move slightly lower, with the 1651 support level being critical. The index did test that support level, dropping below it to 1646.47, but then recovered. It appears that for now that level has held. From that low the SPX formed a 5 wave sequence higher to 1642.47. The first three waves completed as 1651.06-1649.47-1654.69. This was followed by an inverted corrective wave 4 that terminated at 1657.68. The fifth wave of this sequence then subdivided, and completed at 1642.47. It looks like three waves down completed at 1654.81. This would suggest an inverted corrective wave is forming, which would allow the SPX to move higher.


With the 1651 support level holding, it seems likely that the sequence from 1730 has completed, and I would expect a move higher. I am still looking at the 1700 area as an initial target.

Happy Birthday John.


Tuesday, October 8, 2013

Tuesday's Market 10/08/2013

I apologize for my dearth of posts lately. It has been a hectic month. I will try to get up to speed.

In my previous posts, I had stated that I was looking for a move to 1745, followed by a pullback to possibly 1680, and then another move higher to 1776 to complete a 5 wave sequence from the October 2011 low of 1074.77. That obviously to this point has not come to pass. The SPX fell short of my 1745 target, topping at 1729.86, and now has retreated to 1655. I still believe the sequence from 1074.77 has not completed, and the market should make at least one more move to new highs to complete that sequence.


The completion of this wave appears to be even more complex than I had originally thought. The above chart shows my original thought for this wave. This had the first three waves of the sequence completing as 1292.66-1158.66-1422.38, which was then followed by an inverted corrective wave 4 which completed at 1560.33. I was then looking for 5 waves to complete above 1776 to complete wave 5 from 1074.77.


Instead, it appears that the first 3 waves were not waves 1, 2, and 3 of a sequence, but rather Wave 1, Wave A of an inverted corrective wave, and another Wave 1. The move that completed at 1729.86 was the end of a 5 wave sequence from 1158.66, and thus Wave B of the inverted corrective wave. As I have stated in the past, Waves C, D, and E can then complete either as a zig-zag formation, or with Wave D carrying above Wave B (1729.86), to be then followed by Wave E. If this turns out to be the case, the SPX would then still have to complete Waves 3, 4, and 5 to the upside to complete the sequence from 1074.77.


So that would be the current long term count, which leaves us with the shorter term count. The SPX looks like it completed a 5 wave sequence from the 1729.86 high today. Wave 1 completed at 1720.20, and was followed by an inverted corrective wave to 1703.85. The move lower to 1674.99 then completed the third wave. After bouncing up to 1695.55 for the fourth wave, the move today to 1655.03 would complete the sequence.

A lot of information I know. For now, I believe a 5 wave sequence from 1729.86 has completed, or is about to complete. An initial target for this next move higher would be 1700, with resistance at 1668, and then 1685. I would like to see a move above 1668 to confirm the low is in place, and if the 1651 support level does not hold, I would need to re-evaluate the count.