Tuesday, September 10, 2013

Tuesday's Market 09/10/2013

The SPX gapped up again this morning, and barely looked back. After hitting 1681 shortly after the open, the index continued higher until it reached 1683.77. From there the SPX pulled back 5 points, and then worked its way back to the intra-day high, and then surpassed it at the close.


I have been outlining two scenarios lately, one which has the market moving to new highs, 1745, and the other which has the SPX resuming its downtrend to below 1560. I have stated that the 1680-1687 range would be the battleground, and today the index found itself within that range. A top in this area would point to a continuation down to below 1560, while a move above 1687 would indicate a move to new highs.

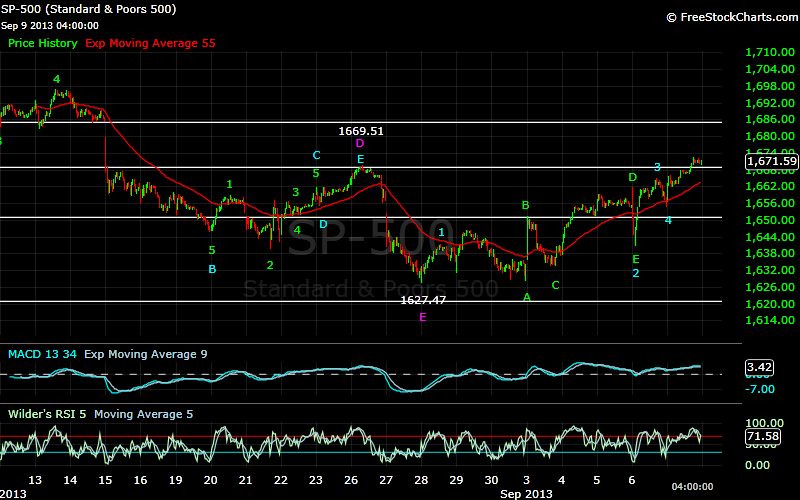
  I have been looking at two wave sequences, with the first being from the 1627.47 low. Wave 1 of this wave completed at 1641.18, and was followed by a complex corrective wave that completed at 1640.62. Wave 3 completed Friday at 1664.83, and Wave 4 at 1654.45. This gives a target for Wave 5 above 1683. The second is from the 1654.45 Wave 4 low. Wave 1 of this 5th wave completed at 1666.15. After a complex corrective Wave 2, this ended yesterday at 1670.01. At the moment it appears that the move above 1683 today only completed Wave 3 of this sequence. The pullback to 1678 then looks like Wave 4, but the SPX has yet to complete Wave 5.

The upper limit of the wave from 1627.47 is 1699, and I can now give a target range for Wave 5 of this sequence as 1690 to 1697. It now appears quite likely that the wave from 1627 will complete between 1690 and 1697, above 1687, and would indicate a move to new highs. I will be looking for a move above 1687 to confirm this scenario. If the SPX moves below 1678.29, the Wave 4 low, before moving above 1687, my short term count from that low is probably wrong, and the more bearish scenario would be in play.

A move above 1687 would indicate new highs, while a move below 1678, without moving above 1687 would most likely mean a move to below 1560.


Monday, September 9, 2013

Monday's Market 09/09/2013

The SPX gapped higher at the open, hitting 1663, and then 1666.15 after a small pullback. After reaching 1666, the index paused, dropping 4.5 points before resuming the move higher. The SPX rose steadily until late afternoon, rising to 1672.4, before spending the last part of the day trading sideways, between that high and 1670.01.


On Friday I said that it appeared the SPX had completed a 5 wave sequence at 1664.83, and another to the downside at 1654.45, indicating another move higher was likely. With today’s move higher, that seems to have been the correct interpretation. The move to 1666.15 this morning looks to be a wave 1, which was followed by an inverted corrective wave 2, which completed this afternoon at 1670.01. This would mean that SPX should make at least one more move higher.

By way of review, I have been looking at two possible scenarios for this wave. The first is that this is part of a complex correction from 1687 that would go something like 1687.18-1560.33-1709.24-1627.47-1685?-1540? This scenario would require the current wave to complete between 1680 and 1687. I erroneously stated on Friday that the SPX would need to drop further than Friday afternoon’s 1654.45 low for the current wave, as I have been counting it, to complete within that range. I apologize for that, as this wave from 1627.47, as currently constructed, could complete above 1683.

The second scenario has 1687.18 as a top, 1560.33 as a bottom, and a 5 wave sequence underway from that point that would go 1709.24-1627.47-1745-1680-1773. This had been the preferred sequence, as until Friday it looked as though the wave from1627 would complete above 1687. However, after I identified the inverted corrective wave on Friday, and the possibility of the SPX completing this wave between 1680 and 1687, both scenarios are at least equally likely, with perhaps a slight edge given to the first scenario.

There are a couple of reasons for this. First, there is a good possibility that this wave will complete within the 1680-1687 range. Second, if this wave does end there, the first support zone is setting up to be in the 1645 area. That would seem to be a pretty severe drop if the SPX were setting itself up for new highs. Also, many of the technicals are reaching overbought levels again.

As I said on Friday, the battleground is shaping up to be in the 1680-1687 range. If the SPX gets above 1687, I would be inclined to think that this market will continue higher. If the index gets into that 1683-1687 range, and then pulls back, it is likely that it is headed lower, most likely below 1560.

Shorter term, I am looking for the SPX to make one more move higher, to above 1683, and that should be followed by a pullback, as it would complete a sequence from 1627. Resistance is at 1685, with support at 1669, 1651, and then 1621.


Saturday, September 7, 2013

Friday's Market 09/06/2013

An unexpected consequence of today’s market action was the somewhat surprising reprisal of the semi-inverted corrective wave from 1687 scenario. I had discounted this over the past several days based on the minimum projection of 1693 for the wave from 1627. Today’s development once again makes this scenario possible, if not probable. I originally presented this scenario in this post: http://5wavemodel.blogspot.com/2013/08/fridays-market-08162013.html.


The SPX gapped higher to open the day, hitting 1661.81 before backing off. The sell-off was pretty steep, with the index shedding over 21 points in less than half an hour. After dropping to 1640.62 the SPX began to recover. The index rallied to 1661.46, then pulled back to 1657.63. Another push higher took the SPX to 1664.83, where it began to sell-off once again. The index fell to 1654.45 just before the close.

It would now appear that this morning’s 1661.81 high marked the end of a 5 wave sequence from Tuesday’s 1633 low. My call of yesterday’s 1659.17 high being the end of that sequence would seem to have been premature. Following that high, the SPX fell to 1640.62, which is where the unexpected consequence comes in. That low completed an inverted corrective wave from last Wednesday’s 1641.18 high. This wave completed as 1628.05-1651.35-1633.41-1661.81-1640.62. This makes it at least possible that the SPX could complete a 5 wave sequence from 1627.47 within the 1680-1687 range necessary for the semi-inverted corrective wave scenario to remain in play.

I had been counting the wave from 1627.47 as a wave 1 to 1641.18, a semi-inverted corrective wave 2 that completed at 1628.05, followed by a wave 3 to 1651.35, and a wave 4 to 1633.41. This would have projected wave 5 to complete at a minimum of 1693. If the SPX moves above 1687, it invalidates this scenario. It is now clear that the semi-inverted corrective wave was a wave A of 2.

It would have been better for this scenario if the SPX had stopped at today’s second high of 1661, and then pulled back. This would have projected a wave 5 right into that 1680-1687 range. If wave 3 of the sequence from 1627 was indeed today’s 1664.83 high, the market would need to correct further than the 1654.45 low we saw just before the close. However, it does appear that the SPX completed a 5 wave sequence from 1665 at 1654.45. If this is wave 4, it would again project a wave 5 above 1687.

The other scenario I have discussing has the SPX in the process of completing a 5 wave sequence from 1560.33 as 1709.24-1627.47-1745-1680-1773. I discussed this scenario in detail here: http://5wavemodel.blogspot.com/2013/09/wednesdays-market-09042013.html.

It appears that the SPX has at least one more move higher in mind, with 1680-1687 setting up to be the battleground. A move into that area, followed by a break to the downside would indicate a move to 1530-1560 is underway. A move above 1687 and the SPX should continue higher to 1745.

I will try to address this in more detail over the weekend.