This morning we saw the breakout to the upside I had talked about yesterday. After a few minutes of trading, the SPX had reached nearly 1423, finally surpassing the previous high from 667 of 1422.38. The market continued higher, reaching 1426.68 by mid-morning. That would be the high for the day, as the market underwent the steepest sell-off it has seen for awhile. With only a few pauses, the SPX fell to 1410.96, before moving higher into the close.

The action today was interesting, and possibly very significant. For quite some time, I have been targeting two possible levels for the termination of the 5 wave sequence from 1267; 1426 and 1497. The wave structure recently has been less than convincing for a major push higher to 1497, although up until today, the market had managed to avoid putting itself in a position to top at 1426. In fact, the DJIA may already have topped.

I have been looking for alternate scenarios for a couple of weeks. The DJIA has been in a topping formation, but the SPX seemed to be trying to avoid a top here, and move ahead to 1497. With the market hitting 1426 today, a level I have been looking at almost since the market bottomed at 1267, and the subsequent sell-off from there, makes it time to seriously consider the market forming a top very soon.
Today, I will start with the DJIA. Some of you may remember that when the SPX was at 1267, and there was some degree of uncertainty as to future direction, I used the wave structure of the DJIA to make my case for the market moving higher.

On June 4th, the DJIA bottomed at 12035.16. That index completed a 5 wave sequence at 12961.30. This can be broken down into sub-waves as 12035.16-12649.86-12398.16-12898.86-12450.40-12961.30. Wave 2 was an inverted corrective wave with the structure 12961.30-12492.33-12977.57-12521.88-13117.70-12780.42. Wave 3 of this sequence carried the market to 13215.90, and wave 4 completed at 13095.18. Today’s move to 13330.68 satisfies my model for the completion of a 5 wave sequence.

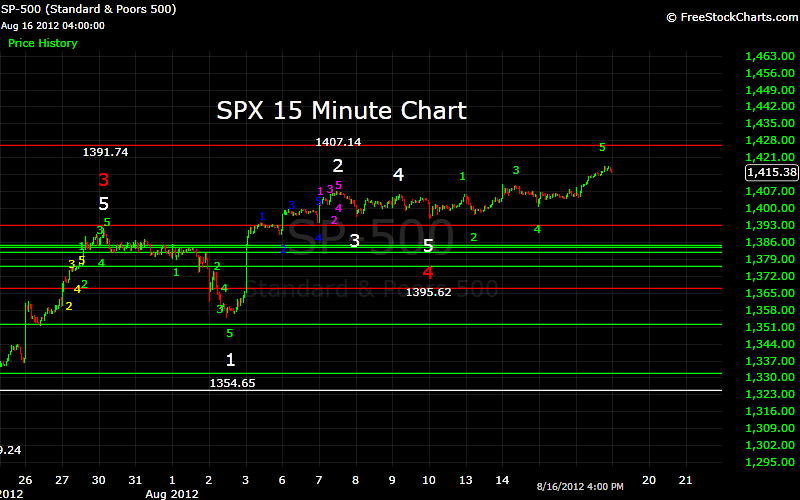
I have posted an alternate scenario on the SPX 60 Minute chart that would put us at a top. The count is slightly different than the DJIA count, but the result would be the same. This count has waves 1-3 from 1267 terminating at 1335.52, 1306.62, and 1363.46, respectively. Wave 4 was then the complex corrective wave, with 4 waves being completed. Wave 4 of this wave terminated today at 1426.68. Wave 5 is underway now, which would complete wave 4, and should then be followed by wave 5 higher. If the corrective wave 4 terminated at today’s low of 1410.96, I would expect wave 5 to end around 1429, only slightly higher than today’s high. If this corrective wave moves lower, it is possible wave 5 would be a failed wave, which means it would not surpass the 1426 high of today.
The SPX has formed some very complex waves during this advance, and it is possible that it has completed a 5 wave sequence from 1267, as the DJIA has. This corrective wave 4 could carry as low as 1395, and still keep this scenario intact. If the market moves below that level, it is likely the wave 5 top occurred at 1426. If wave 4 carries down near 1395, the failed wave 5 may only make it back to 1406.
I see this as the completion, or near completion, of wave 3 from the 667 lows. Given the wave structure thus far, wave 5 may only make it slightly above todays high.