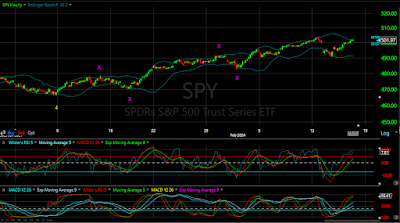
The week started on a positive note, as SPY opened higher on Monday, getting as high as 503.50 during the morning. It gave up those gains during the afternoon, dropping near the 500 level before closing slightly below Friday's close. A disappointing CPI report sent the market lower on Tuesday, breaking through the 500 level, and back down to the 490 level. The remainder of the week was spent recovering from that drop, with SPY getting back above 500 on Thursday and Friday, but closing the week just below that level at 499.51.
This blog introduces a new way to analyze the stock market. The 5 Wave Model uses relationships between up and down movements, or waves, in the price action to determine turning points in the market.
Sunday, February 18, 2024
Friday, February 16, 2024
Friday Update 02/16/2024
The market opened flat this morning, but quickly made it's way lower in early morning trading. Just after 10:00 SPY fell to 498.75, and once again testing the 500 level. It did find support at that level, and by noon it had rallied to 502.46. SPY drifted lower over the next hour and a half, falling back to test the 500 level once again at 500.74. Another rally off that support took SPY to a new high for the day at 502.87, just after 2:00. That rally quickly evaporated, and Spy soon found itself bouncing around that 500 level. This time that level failed to hold, with SPY dropping to 498.98 before closing just above that at 499.51.
Thursday, February 15, 2024
Thursday Update 02/15/2024
The rally off Tuesday afternoon's low continued today, as SPY opened to the upside, and continued higher throughout the day. SPY opened with a small gap to the upside, and zeroed in on the 500 level first reached last Friday. Within the first half hour SPY did regain that level, if only momentarily. After hitting a high of 500.38 SPY turned lower. and fell to 498.80 just after 11:00, closing the opening gap. The "buy the dip" mentally took over once again, and SPY moved above 500 once again by 1:00. After one more dip just below the 500 level, SPY moved higher through the rest of the afternoon, hitting a high of 502.20. SPY then fell back towards the 501 area before rallying near the close, and ending the session at 502.01, just off the high of the day.
Our target remains the 517 level as the completion of a 5 wave sequence from the October 2022 lows.
We have been following the wave structure from the Wave 4 low which terminated on January 5,2024.
There seems to be 4 waves completed thus far from that low, which I've identified with the purple X's. If this completes as a simple 5 wave structure, the target to complete this wave, and therefore the entire sequence from the October 2022 low would be above 522, right in line with our longer term target. This wave could still take several forms from here, but we would expect that 517 area to remain the target level.
On the 15 Minute chart we can follow the structure from the last purple X above.
Once again we see four completed waves, denoted by the green X's. From the last wave we can see a Wave 1 to the upside, followed by an inverted corrective Wave 2. If this completes as a simple 5 wave structure, it would terminate near 504. This would not be sufficient to complete the higher wave sequence on the Hourly chart. If SPY does move significantly above 504, we could expect a more complicated wave structure, but would continue to target the 517 level. If 504 does hold here, we would expect another pullback of 9-10 points before resuming the uptrend.


