Thursday, October 2, 2014

Thursday's Market 10/02/2014

It did not take the SPX long to choose between the two paths I described on Tuesday. Wednesday the index opened decidedly to the downside, confirming the inverted corrective wave that terminated at 1985.17. The SPX continued lower from the open, falling to 1926.03 this morning with only two noticeable bounces along the way.

Once the SPX had fallen to 1926.03 by late morning, the first real attempt at a rally from the 1985.17 occurred. The index climbed steadily through the remainder of the day reaching 1952.32 before falling back slightly into the close.


I count nine waves from the 1985.17 high to the 1926.03 low. The first wave ended at 1968.96. The next five waves completed an inverted corrective second wave, 1977.73-1954.30-1964.33-1945.44-1951.10. The next three waves, 1934.82-1938.15-1926.03 then completed a 5 wave sequence.


Recalling the count from 2019.26, the SPX completed the first wave at 1978.63. The index then completed an inverted corrective wave at 1985.17. Notice that the end of this wave, 1985.17, completed above the termination point of the first wave, 1978.63. Sometimes this indicates the completion of only the first wave in an ongoing corrective wave. This may be a possibility in this case, with 1985.17 being a wave a, and today’s 1926.03 low being wave b. The short term count from 1926.03 indicates three waves, which would then complete the entire second wave from 2019.26 at 1952.32. I am now looking for three waves down to complete a 5 wave sequence from 2019.26.

My target for this initial decline from 2019.26 is 1917. This should complete with a move below 1932, a small bounce, and then a final decline to 1917.

If 2019.26 was the end of a sequence from 1074.77, several preliminary targets can be estimated. There a couple of interesting possible scenarios that I will elaborate on as this wave unfolds.  One of these scenarios suggests the SPX will complete this wave above 1881. Should that level be broken to the downside, I would look for a move below 1748.


Tuesday, September 30, 2014

Tuesday's Market 09/30/2014

It was another up and down for the SPX today. This choppy action has been the norm for the better part of four days, and has been difficult to follow on the short term. I thought it best to focus on the longer term today, and outline the possibilities as they stand at the moment.


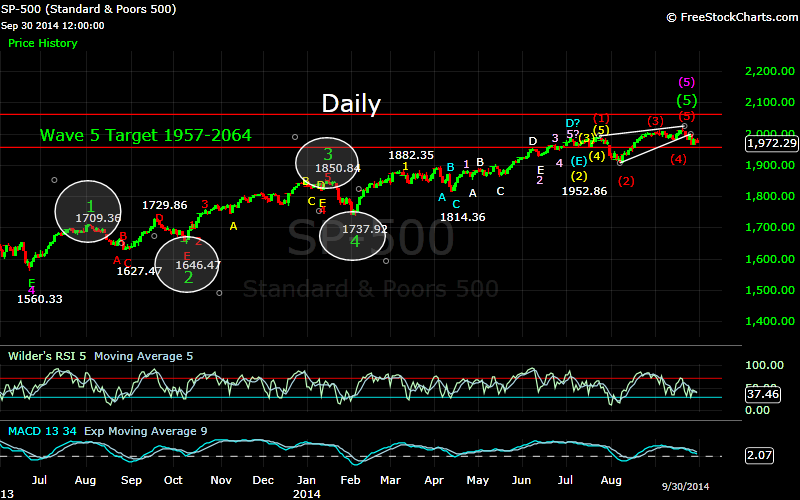
Looking at the Weekly chart, I identified 4 waves that completed from 1074.77 to 1560.33, with the SPX needing only to complete the 5th wave to complete the sequence from 1074.77.


On the Daily chart I identified a complete 5 wave sequence from 1560.33 to the recent 2019.26 high. The completion of this wave at 2019.26 would complete the 5th wave from 1074.77, and therefore I have been looking at that point as the termination of a 5 wave sequence from 1074.77. Unless the SPX moves above 2019.26 it appears the index is in the beginning stages of a correction of that sequence.


On the 60 Minute chart, the initial decline to 1978.63 looks to be a first wave a sequence lower. From that point, the SPX moved higher to 1999.79, lower to 1965.99, back up to 1986.37, back down to 1964.04, and then made one more move higher to 1985.17. Looking at this sequence gives 1978.63-1999.79-1965.99-1986.37-1964.04-1985.17. The points (1978.63, 1999.79), (1965.99, 1986.37), (1964.04, 1985.17) gives an R^2 value of .99756, meeting the parameters for a 5 wave sequence, and possibly the completion of an inverted corrective wave from 1978.63, or the second wave from the 2019.26 high. If this count is correct, I would expect a resumption of the decline from this point.

My concern with this count is the shorter term counts, which makes it difficult to be certain of this count. After the initial decline from 2019.26, I had somewhat expected a slightly different correction to form, namely a semi-inverted corrective wave, which is still a possibility. If it does occur now, it would actually contain another semi-inverted corrective wave within it. This would look something like this:


If this scenario does play out, the SPX should move up to 1989, pullback with the index holding above 1978.48, and then move above 1999.79, but falling short of new highs. The next few days should give us a good idea of which path the SPX is taking.

Monday, September 29, 2014

Monday's Market 09/29/2014

It was another interesting day, where obviously Friday’s rally did not continue as I had anticipated. Instead the SPX fell sharply at the open, dropping to 1964.04. From there the index rallied in somewhat choppy trading, cutting the bulk of its losses.


Although this wave did not play out completely as anticipated, I am still inclined to believe that this is a convoluted wave Thursday’s 1965.99 low that has yet to complete. My target for this wave is 1997. A move below 1976.76 would invalidate this count. I am also still looking at 2019.26 as the completion of the wave from the 1074.77 low.