Monday, July 14, 2014

Monday's Market 07/14/2014

It certainly appears that Thursday’s 1952.86 low marked the end of the recent decline from 1985.59. If this count remains 
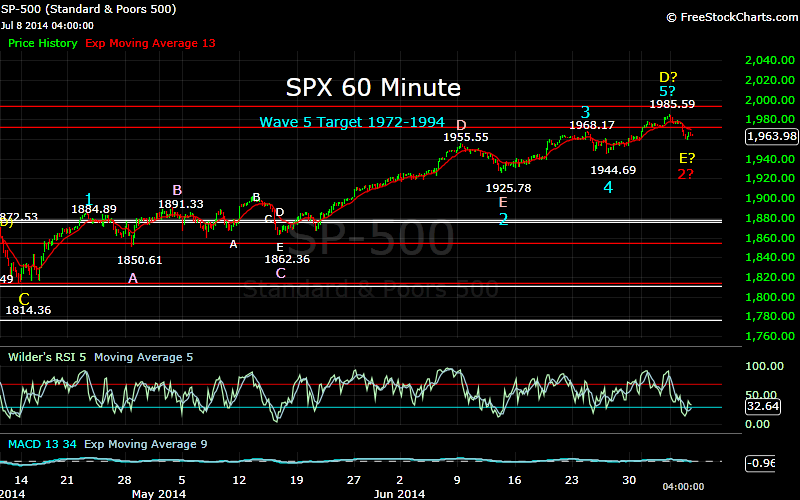
intact, it means that the SPX has completed the inverted corrective Wave 2 from 1737.92, and is now in Wave 3 as I discussed last week. When the index completes Wave 5 of this sequence it will complete the entire sequence from the October 2011 1074.77 low.


After falling to 1952.86 last Thursday, the SPX staged a rally to 1969.84, and then traded in a narrow range through the end of last week. The index appears to have formed a series of nested waves that eventually resulted in the gap up this morning and the ensuing rally to 1979.85. After reaching that high mark, the SPX then traded in a very narrow range for the rest of the day between that high and 1976.22.

The 5 Minute Chart shows the nested waves, which by my count contain four degrees of waves from the 1952.86 low. The first degree wave was the initial rally to 1969.84. The pullback from that high now appears to be three waves of an ongoing inverted corrective wave.  Following a lower opening on Friday to complete that 3rd wave, a lesser degree Wave 1 formed, which was followed by a small pullback. The SPX went on to form two more lesser degree Wave 1’s, and then began to unwind all those nested waves. At this point it appears there is still more upside potential with the SPX now in Wave D of 2 from the 1952.86 low. Wave D should complete near 1991(1985-2002), which should then be followed by a pullback greater than 8 points to complete Wave 2. The index should then continue higher as it completes Waves 3, 4, and 5.

From this point the SPX should move higher to 1991 +/-, pull back 8+ points, and then continue higher.


Thursday, July 10, 2014

Thursday's Market 07/10/2014

After falling to 1959.46 on Tuesday, the SPX continued the late Tuesday afternoon rally that followed that low into Wednesday. The index gapped higher at the open, and then chopped its way to a high of 1974.15. Today saw the SPX gap down, quickly dropping below Tuesday’s low to 1952.86. After that the index went into recovery mode, rallying back to 1964.10. After a slight pullback, the SPX continued higher, climbing back to 1969.84 before pulling back to 1962.16 before moving higher into the close.


With the SPX falling below Tuesday’s low of 1959.46, it now appears that my short term count was wrong. I had cautioned on Tuesday that there might be one more move down, and that seems to have occurred today. The decline from 1985.59 can now be counted as 1974.88-1977.58-1959.46-1974.15-1952.86. My mistake was in counting the move from 1974.88 to 1977.58 as 3 waves, when it appears to have been 5 waves. Without changing any other waves, the decline from 1977.58 to 1959.46 can be counted as a 5 wave sequence. The choppy action from the 1959.46 low also looks like a 5 wave sequence, 1967.56-1962.58-1971.15-1965.22-1974.15.

After falling to 1952.86 this morning to complete 5 waves from 1985.59, the SPX rallied. The initial bounce to 1964.10 was a 5 wave sequence. This was followed by a pullback to 1961.30, and then another 5 wave sequence to 1969.84. The pullback rally to 1969.84 appears to be Waves A and B of an inverted corrective wave 2. The decline to 1962.16 then completed Waves C, D, and E of this corrective wave. With Wave D also being an inverted corrective wave. If this count is correct the SPX should continue to rally, most likely to new highs.

I am still counting the decline from 1985.59 as Wave E of an inverted corrective wave that began in March at 1882.35. My lower limit of 1937 for this decline is based on the range in which Wave E of this inverted corrective wave can complete.


Tuesday, July 8, 2014

Tuesday's Market 07/08/2014

The SPX continued the decline that began yesterday, gaping down at the open, and then continuing lower to 1962.59 without a meaningful bounce. After moving up to 1966.08 the index chopped lower, falling to 1959.46. A more substantial bounce to 1967.56 followed, with the SPX then fading into the close.


From last Thursday’s 1985.59 high it is now possible to count a 5 wave sequence to today’s 1959.46 low within the range needed to complete the next higher degree wave. This count can be seen on the 5 Minute chart. The SPX first completed a 5 wave sequence at 1974.88, which was followed by an inverted corrective Wave 2. Waves 3, 4, and 5 completed in quick succession, with Wave 5 completing at 1959.46. A move below 1959.46 would indicate there is further downside to this wave, but I see the lower limit of this decline 1937.


Looking at the wave count on the 60 Minute chart, it appears that the SPX completed a 5 wave sequence from 1814.36 Thursday at 1985.59. Wave 1 completed at 1884.89. Wave 2 was an inverted corrective wave which completed as 1850.61-1891.33-1862.36-1955.55-1925.78. Wave 3 then completed at 1968.17 and Wave 4 at 1944.69. After the completion of Wave 4, it was possible to calculate the range in which Wave 5 should complete. This range is between 1972 and 1994, so Thursday’s 1985.59 fits nicely as the Wave 5 top.


The 4 hour chart shows that the 5 wave sequence from 1814.36 that completed on Thursday was Wave D of an ongoing inverted corrective Wave 2 from 1882.35. The current decline is thus Wave E of that inverted corrective wave. If the decline is over, the SPX should now go on to complete Waves 3, 4, and 5 to the upside. This would complete Wave 5 from 1560.33, and complete the sequence from the October 2011 1074.77 low. With 4 waves from the 1560.33 low completed, the Wave 5 range can again be calculated, and yields 1957-2064 as my current target.


Since this market has been so resilient, and seemingly unwilling to make any sustained move to the downside, I will continue to monitor it one wave at a time.