The 1893-1894 resistance area looms large after
today’s trading. A misinterpretation of the last pullback mentioned in
yesterday’s analysis led to an incorrect conclusion as to what would unfold
today. Instead of resuming the move lower, the SPX gapped up and barely looked
back on its way to 1888.80.
It is easy to get caught up in the daily gyrations
of the market, but important to keep the larger view in mind. Looking at the
Weekly chart above, the SPX completed Wave 1 at 1219.80, Wave 2 at 1010.91, and
Wave 3 at 1370.58, from the 666.79 low. From that point the index appears to be
in an inverted corrective Wave 4, with Wave A completing at 1074.77. Wave B of
4 has been unfolding ever since, meaning I do not see the end of this bull
market as imminent.
This Wave B is unfolding in a similar fashion,
with Waves 1, 2, and 3 completing as 1292.66-1158.66-1422.38. Wave 4 was also
an inverted corrective wave in this case, and completed at 1560.33 as
1266.74-1474.51-1343.35-1687.18-1560.33. The minimum target for Wave 5 was
1776, which of course the SPX has already surpassed. I am now looking for the
lesser degree waves to complete a 5 wave sequence to mark the end of Wave 5,
and Wave B of 4 from 666.79.
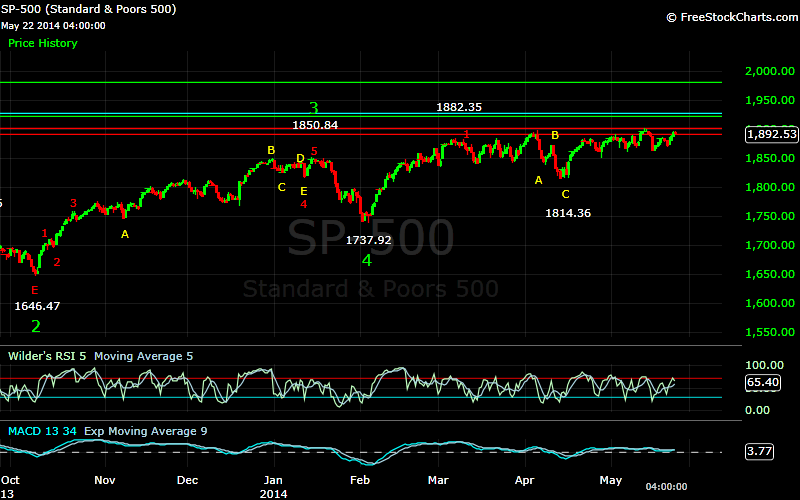
To re-iterate, I am looking for the SPX to now
complete a 5 wave sequence to complete the entire sequence from 1074.77. I am
counting this wave thus far as Wave 1 at 1709.36, an inverted corrective Wave 2
at 1646.47, Wave 3 at 1850.84, and Wave 4 at 1737.92. Wave 5 in this case gives
a minimum target of 1957. Wave 5 to this point looks to have completed Wave 1
at 1882.35, and Waves A, B, and C of an inverted corrective Wave 2, with Wave C
completing at 1814.36.
The wave from 1814.36 can be counted in two main
ways at the moment. First, it can be series of nested waves,
1884.89-1850.61-1891.33-1862.36. It can also be looked at as Wave 1 at 1884.89,
Wave 2 at 1850.61, Wave 3 at 1891.33, and an inverted corrective Wave 4 at
1862.36. This is the count that gives a Wave 5 target at the 1893-1894 level I
mentioned at the beginning.

I won’t go through all the possibilities at this
point, but I thought it important to give an overall view of my count. So that
brings us to the wave that started at 1862.36. A five wave sequence ended at
1886.00, and appears to be a wave 1. I thought this was possibly the end of
Wave D of an inverted corrective wave from 1884.89. A drop to 1852 would have
completed this wave. Given yesterday’s action this seemed a likely scenario, as
the SPX moved down in what appeared to be 3 waves. The bounce into yesterday’s
close appeared to be a wave 4, with a wave 5 target of 1852. That seemed to fit
pretty nicely, but the market usually has a mind of its own. The gap up open
put this count in jeopardy, and by the middle of the day it was obvious that
this was the incorrect interpretation.
The very small pullback into the close yesterday
was part of an inverted corrective wave, but in the opposite direction. The
bounce yesterday afternoon to 1875.89 now looks like a wave 1. That pullback, followed
by the strong open this morning to 1886.06, and finally the pullback to 1879.87
look to complete an inverted corrective wave 2. The SPX then completed 3 waves
up from that point to 1887.32 to complete waves 3, 4, and 5. This looks to be
Wave D of what turned out to be an inverted corrective Wave 2 from 1886.00. The
next pullback to 1882.12 completed this wave.
So now the SPX sits at a pretty important point.
The resistance level I have been mentioning is very narrow. At this point the
current wave from 1862.36 would have to complete between 1892.5 and 1894.5 to
complete a larger wave from 1814.36. This would then imply a pullback back into
the 1850 level. Since this resistance area is so narrow, it is easy to gap
over, or push through. The very short term count for the last move higher today
looks like a wave 1 followed by an inverted corrective wave, so it looks like
we will start off higher tomorrow.
If the SPX gets above 1894.5, it is more likely
that the move from 1862.36 is part of a larger inverted corrective wave 2 from
1814.36, and possibly a more bullish scenario. This would likely signal a “breakout
“ from the current trading range, while the first scenario would likely mean
continued choppiness into 1957.