Thursday, March 13, 2014

Thursday's Market 03/13/2014

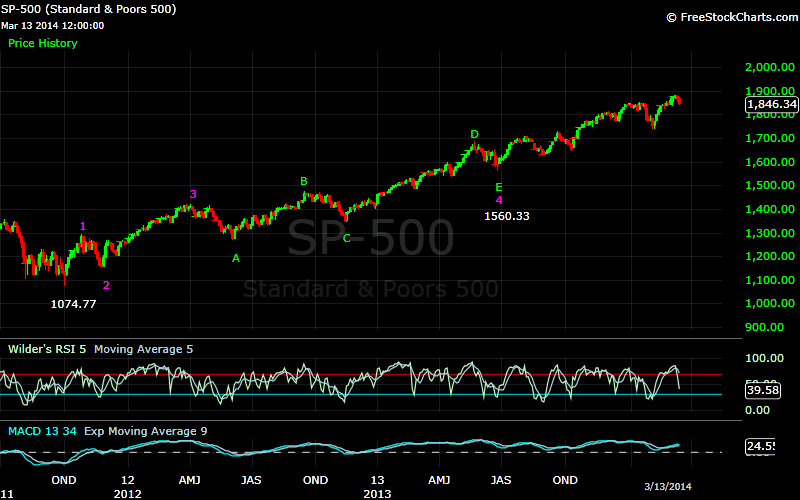
Although it is still possible that the SPX is still correcting the wave from 1834.44, it is becoming much more likely that the index has completed a wave from 1737.92. If this turns out to be true, the SPX is likely in Wave E of an inverted corrective wave from the August 1709.36 high, which would have a target of 1758.

 When the SPX reached 1878.16 last Friday afternoon, it completed a sequence from the 1834.44 low. I have been looking at the action from that point as a corrective wave. The alternative is that the index made three waves down to 1867.04, and then three waves up as 1879.73-1872.73-1882.35. This would have completed an inverted corrective wave from the 1858.71 high as 1834.44-1878.16-1871.59-1877.86-1867.04, and in turn a 5 wave sequence from the 1737.92 low as 1858.71-1867.04-1879.73-1872.73-1882.35.


From that high, I see a complete sequence to 1854.38, followed by three waves up to 1874.40. This is likely part of an inverted corrective wave that has yet to complete. Today the index completed a sequence to 1845.81, and then rebounded to 1852.98, before completing another sequence down to 1841.86. With a sequence from 1882.35 not yet complete, this market should have further to go on the downside.

In the short term, resistance is at 1853, and then 1863. If the SPX gets much above 1863, this all may have been a corrective wave from 1878.16. Near term support is just below today’s low of 1841.86.


Wednesday, March 12, 2014

Wednesday's Market 03/12/2014

Yesterday I said a move below 1863.88 would likely mean an end to the wave from 1737.92. Today the SPX moved below that at the open, falling to 1854.38, but did so in a manner that seems to leave intact the recent rally.


My count has Friday’s 1878.16 completing a 5 wave sequence from 1834.44. This was followed by a semi-inverted corrective wave that I thought had completed yesterday at 1863.88. When the SPX dropped to 1858.08 at the open, and then bounced to 1860.93, another possibility revealed itself. Wave C of the semi-inverted corrective wave completed yesterday at 1868.51, and I then counted the move to 1873.69, and then 1863.88 as Waves D and E. Looking at the entire sequence from 1868.51 to 1860.93, 1873.69-1863.88-1868.41-1858.08-1860.93, it became apparent that Wave D was an inverted corrective wave, which completed at 1860.93. The final drop this morning to 1854.38 then completed the semi-inverted corrective wave from 1878.16.


I continue to look at the wave from 1560.33 as the final wave from October 2011 1074.77 low. The wave from 1560.33 has likely completed four waves thus far. The first wave ended at 1709.36, and was followed by an inverted corrective wave which completed at 1646.47. Wave 3 carried the SPX to 1850.84, and Wave 4 ended at 1737.92. From 1737.92 the SPX looks to have completed two waves at 1858.71 and 1834.44 respectively, and now Waves 1 and 2 of 3 at 1878.16 and 1854.38. I continue to look for Wave 3 from 1737.92 to complete above 1909, and the complete sequence from that point above 1957, with an optimal target of 2001. A drop below today’s 1854.38 low would likely mean my alternate scenario is in play.


Tuesday's Market 03/11/2014

The wave I have been tracking from the March 3rd 1834.44 low got off to a rousing start. The SPX quickly rose to 1876.23, but then lost momentum while moving to 1883.57. From there the index dipped to 1867.04 on Monday, and then tried to test the high this morning, but failed, topping out at 1882.35. The rest of the day found the SPX falling steadily, dropping to 1863.88 before recovering into the close.


I had been looking at the degree of this wave to be equivalent to that of the 1737.92 to 1858.71 wave, and had put a minimum price of 1909 on it. The wave from 1834.44 started with a move higher to 1848.54 for Wave 1. The pullback to 1840.43 that followed I count as Wave A of 2. Wave B encompassed the remainder of the move higher, completing at 1883.57. Waves C, D, and E of two then followed, bringing the SPX down to 1870.56. From that low the index moved higher in three waves to 1878.16, which complete Waves 3, 4, and 5, and completed a sequence from the 1834.44 low.

Since completing that sequence the SPX has been in another extended corrective wave, much as it did after reaching the 1858.71 high. This corrective wave has also been comprised of a semi-inverted corrective wave, as was the case following the 1858.71 high that contained within it another semi-inverted corrective wave. Wave A of this wave ended at 1867.04 and Wave B at 1879.73. Wave C itself took the form of a semi-inverted corrective wave, and completed at 1868.51. Wave D followed at 1873.69, and Wave E at today’s low of 1863.88. From there it appears the SPX rose in a 5 wave sequence to 1868.41, and was followed by three waves to the downside.


Normally only one corrective wave in a sequence is a complex wave, so give the fact that Wave 2 from the 1737.92 low, and the recently completed corrective wave are complex, it is likely that they are of different degrees. This means that the wave sequence from 1834.44 to 1878.16 was only wave 1 of 3 from 1737.92, and not the entirety of Wave 3. I am still looking for Wave 3 to complete above the 1909 level.

From today’s low of 1863.88, the SPX formed a 5 wave sequence to the upside, followed by three waves lower. The three waves lower are likely part of an inverted corrective wave, and I would be looking the index to continue higher from here.

At this point, if the SPX moves below 1863.88, there is a good possibility that something completely different is going on. My alternate count has the index in an inverted corrective Wave 2 from the 1560.33 low. A move below 1863.88 would indicate that the SPX has begun Wave E of this corrective wave, and could be headed much lower.