Sunday, June 2, 2013

Weekend Outlook 06/02/2013

Coming off the long holiday weekend, the market began the week on a positive note, gapping higher at Tuesday’s open, and quickly moving to 1674.21. That would prove to be the high for the week, as the market just as quickly reversed course and headed down. Following a gap down open on Wednesday, the SPX fell below Friday’s closing level to 1640.05, and then rallied into Thursday. This rally carried to 1661.91, and then failed. After a choppy open on Friday, and a small bounce, the SPX headed further south, with the selling accelerating into the close, as the SPX closed the week at its low of 1631.67.


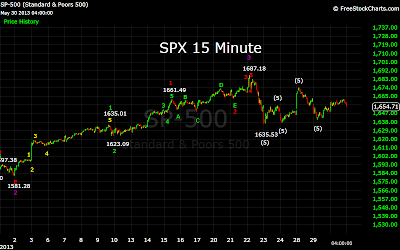
By falling below the previous low of 1635.53, the SPX signaled that it was still in a downtrend from the 1687.18 high. Since the wave structure from that high has not yet completed, I believe this move has further to go. The question now is whether this is the start of the move down to the 1540 level, or whether this move lower will stop short of that, and stage one more rally, possibly to one more new high.

My count from 1687.18 now shows the completion of four waves, with Wave 4 terminating at 1661.91. A move below 1618 would complete Wave 5, and set the stage for a rally off that low. While that rally may lead to new highs, it is possible that it may fall short of that level. While there is a cluster of support between 1618 and 1621, and would provide a good stopping point for this move, it could end at a lower level. I would put the lower limit of this move at 1595.

By my count, the SPX needs to put in a low, and stage one more rally to finally complete the entire move from 1343.35. At that point I would expect a deeper correction, down to the 1540 level.

Thank you.


Saturday, June 1, 2013

Friday's Market 05/31/2013

I will apologize in advance, but I am a little pressed for time tonight, so I will have to be brief. I will go into more detail over the weekend, but considering that today was the day many have been waiting for, including me, I wanted to at least touch on today’s developments.

Today was the day that the SPX finally broke through the 1635.53 low, and ostensibly clear up the muddled counts of the last week and a half. However, the break of that low seems to have created more questions than answers.

I am not counting out the possibility of this now turning into a deeper correction, one that will take the SPX into the mid-1500s. However, this market has been full of surprises, and there is no reason to believe that the market is not setting us up for another one. With this in mind, I will offer a possibility of this correction nearing an end.

I present this count on the 15 Minute chart, and it would be Wave 1 at 1672.96 from 1687.18, followed by an inverted corrective wave that ended at 1674.21. Wave 3 would have ended at 1640.05 and Wave 4 at 1661.91. This would project Wave 5 at 1619.


While the trend of the market is now to the downside, it could get interesting should we see a capitulation move on Monday. A sharp sell off at the open, followed by a strong, may mark the end of this move.

Again, I am far from calling this move over, but it is something to watch for on Monday. I will follow up with a more detailed analysis over the weekend.

Thank you. 

Thursday, May 30, 2013

Thursday's Market 05/30/2013

The market continued the rally from Wednesday’s 1640 low, opening higher and continuing higher throughout most of the day. After some choppiness at the open, the SPX rose steadily until it reached 1659.27. Yesterday I gave 1659 as a first target for this move. After pulling back to 1654, the SPX moved above 1660, and then pulled back to 1656. One final move higher to 1661.91 followed, but was met with some selling pressure, as the index quickly fell to 1654. The 1661.91 high was slightly below my 1665 target.


My count has the 1657.29 as the completion of a 5 wave sequence from yesterday’s 1647.69 low. This is what I thought would be Wave 4 from 1640.05. This was followed by a sequence down to 1654.27, which should have been Wave 4, and a sequence higher to 1661.91. This should have completed Wave 5, and a sequence from the 1640.05 low. However, when I put this series together, 1640.05-1648.38-1647.63-1657.29-1654.27-1661.91, it does not meet the threshold for a completion of that sequence. That would indicate that this move higher has further to go. If the SPX gets above 1662, the count I am looking at would indicate a move near 1700 is underway. This would project to the same area as a possible 5 Wave sequence from 1635.53.


Until the SPX moves above 1662, it is still possible that the market is still in a correction from the 1687 high. Any move below 1635 would mean a further decline is likely.

Thank you.