Wednesday, June 27, 2012

Wednesday's Market 06/27/12

The market opened higher today, quickly moving above the 1323-1326 resistance level to 1327.54. The market then pulled back into that resistance zone to 1323, before moving higher once again. A strong rally off 1323 brought the SPX to almost 1332, and then dropped to 1323. Another rally took the SPX above 1333 and after one more pullback to 1329, rallied to the high of the day at 1334.40. A dip into the close took the market to 1331, before moving higher just before the close.

Yesterday I outlined two scenarios for the market. The first had the SPX completing wave 2 from 1307 Monday at 1309.27. I saw 3, and possibly 4, waves having been completed from 1309, with wave 5 projected to terminate at 1341. The second scenario assumed that 1363 completed a 5 wave sequence from 1267, and the market was headed lower. The most likely count from 1363 would be an inverted corrective wave 2, with an upper limit of about 1329. Today, when the market moved above that level, that count was eliminated, and the first scenario continues to be the most likely in my view.


It appears 4 waves have completed from 1309, wave 1 at 1320, and wave 3 at 1324. Wave 4 completed Wednesday at 1319.62, along with waves 1, and 2 of 5. Today we saw wave 3 at the open, then an inverted corrective wave 4, which terminated at 1328.86. So far, it appears 4 waves have completed from 1328.86. So now I am looking for wave 5, of 5, of 5 from Monday’s 1309 low. I am raising my projection for that wave to 1349, from 1341. This should complete wave 3 from the 1310.51 low.
 
There is one bearish scenario that suggests a 5 wave sequence being completed at today’s 1334 high. Should the market break below 1328 before making a new high, this count may be in play, and the market could see a sharp decline.

Short term support remains at 1326-1323, and then 1315-1313.


Tuesday, June 26, 2012

Tuesday's Market 06/26/12

The market opened higher today, continuing the rally from Monday. The SPX hit 1320 within the first fifteen minutes, and then started to sell-off. First, the market fell back to the 1315-1313 support area. After trying to bounce off 1313, the market broke below that support, falling back to 1310. The market found some buyers at that point, breaking back above 1315. From there, the market rallied again, making it back to 1320, and then finding its way to 1323-1324 resistance area. After hitting its high at 1324, the market bounced between 1320 and 1324 into the close, closing near the bottom of that range.

The opening move higher completed a 5 wave sequence from Monday’s 1309 low. Wave 2 then completed at the day’s low of 1310. Another 5 wave sequence completed at 1324, completing 2 waves from Monday’s low. It is possible that wave 4 completed at 1319, with a lesser degree wave 1, and 2 finishing the day.

If this count is correct, wave 5 should terminate above 1340. Both the 5 wave sequence from 1309 and the sub-wave sequence from today’s wave 2, on the 60 minute chart. This scenario would remain intact unless wave 4 carries below the 1313 support level.
The above scenario assumes my current count is correct. That count is wave 1 from 1267 completing at 1336, wave 2 1307, and wave 3 from 1267 underway. Thus far from 1307, I have wave 1 of 3 completing at 1327, and a semi-inverted corrective wave 2 terminating Monday at 1309. This still seems to be the best count, as I still have trouble discerning 5 waves up from 1267.

Although I do not see a 5 wave sequence from 1267, it is possible that it has occurred. The move down from 1363 can also be seen as a wave 1 to 1346, and an inverted corrective wave 2 in progress. Under that scenario, the market would currently be in wave 5 of that sequence. The upper limit for this scenario is a wave 5 high of 1329. A move above that level would nullify that count, with my first scenario remaining intact. Should this inverted corrective wave scenario turn out to be correct, I would expect to see waves 3, 4, and 5 to the downside. This move could be rather sharp, and could carry the market down to the 1297, or 1290 support level. This would not, in my view, necessarily mean the market would move below 1267. It is entirely possible that this would be wave 2 from 1267.
Short-term, I look for a move above 1329, to result in wave 5 terminating above 1340. A move below 1310 would most likely see the market moving down to 1297, or 1290. Support remains at 1315-1313, with resistance still at 1323-1326.


Monday, June 25, 2012

Monday's Market 06/25/12

Let me be the first to admit that I was completely wrong about today’s market. I was looking for a continuation of the move up, and instead the market sold off in rather dramatic fashion.

The market gapped down, and soon found itself at the 1315 support level.  But the market was still not done. After a brief rally attempt, the market continued down below the 1313 support, to 1309. At that point the market was done, spending the rest of the day moving steadily higher to 1316.60, before fading into the close.

The SPX broke some of my important levels today, first breaking through last Thursday’s low, then the 1323-1326 support, then the 1315-1313 support, and finally 1310.51, before the rout was over. The 1311 level was important because it was the wave 2 low from 1307. This means that either my counts were wrong, or something else has been going on since that low. I still think my current counts from 1267 are the best ones, and instead of totally disregarding those counts, I have to look at other possibilities. I did get the count wrong for Friday’s rally, as it is now apparent that the move from 1327 to 1337 was a 5 wave sequence.

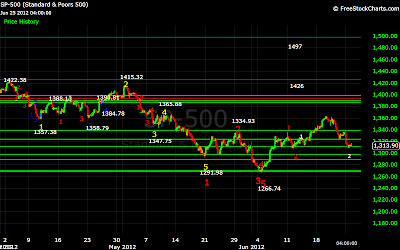
Although the SPX moved below the 1311 low, it did hold above the 1307 low. The simplest explanation, and one that keeps all of the 5 wave sequences thus far intact, is that the entire move from 1327.28, to today’s low of 1309.27, has been a semi-inverted corrective wave 2. I have super-imposed the labels to show that all the other sequences remain intact. An example of a semi-inverted corrective wave can be seen on the hourly chart. After the initial drop from 1422 to 1357, the market rallied to 1388, then formed a semi-inverted corrective wave to 1358.79. This count keeps all of my original projections intact, with 1393 being the most likely target for wave 3 from 1267.

From todays low, the market formed a 5 wave sequence to 1316.60. Short term resistance is still 1323-1326, with support at 1315-1313. Should the market fall below the 1307 low, a re-test of 1267 is probably next. At the moment I remain very cautiously bullish, but I will take it one step at a time.