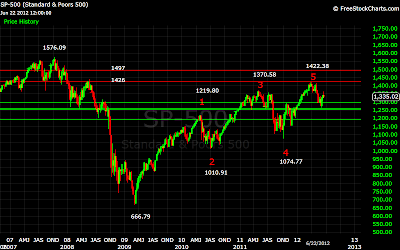
It appears that the market has reached a very critical juncture. In February of this year, as the market approached 1370, my model indicated that a 5 wave sequence from 667 was nearing an end, and the stage was set for a major correction. The market peaked at 1422, then fell to a low of 1267, at which point my model indicated the correction was at an end, but left open the possibility of slightly lower lows. Since then the market has staged a sizable rally, making it back to 1363 this past Tuesday.
As of last week, the market had completed a 5 wave sequence from 1267 to 1336. A 5 wave sequence down, to 1307, followed. These two sequences then became waves 1, and 2 of a larger sequence. From 1307, a 5 wave sequence of one lesser degree completed at 1327. This again became a wave 1, with the corrective wave to 1311 becoming wave 2. The market then completed 3 waves of one lesser degree at 1327, 1321, and 1343.
Last weekend, I outlined the most probable sequence to complete the waves from 1267. This included wave 3 of the sequence from 1307 terminating at 1367, wave 3 from 1267 terminating at 1393, with wave 5 of that sequence terminating at either 1426, or 1497.
The week started off rather flat, as the market completed an inverted corrective wave 4 from 1311. On Tuesday the market rallied, as wave 5 from 1311, and wave 3 from 1307 completed at 1363.46, very near the 1367 target. On Wednesday the market faltered, losing ground, but not undergoing the significant correction I suggested last week. Thursday, however, the market did undergo that correction, selling off to 1324.21, right within the 1326-1323 support. At this point my model suggested a 5 wave sequence from the 1363 high was near completion, and this was confirmed on Friday. The market opened higher, as my model suggested, tested Thursday’s low, again as suggested, and then moved higher the rest of the day.
So now, from the 1267 low, the market has completed 2 waves, at 1336, and 1307, and 3 waves of one lesser degree at 1327, 1311, and 1363 from 1307. A fourth wave from 1307, at 1327, may also have completed.
If wave 4 did, indeed terminate at 1327, the market would now be in wave 5 from 1307, to complete wave 3 from 1267, which I projected last weekend to terminate near 1393. This projection was based on the sub-wave structure of wave 1, which was the move from 1267, to 1336. Sub-waves normally give two separate projections. I chose this one because the other was much higher, and seemed less plausible. Having now completed wave 3 from 1311, to 1363, the sub-waves from that sequence can be used to create a projection to the same point, and the entire sequence from 1307 can now be used for a third projection to the same point. Using the first two projections, the target range for wave 5 can be narrowed to 1373-1381. Given a wave 4 termination point of 1327, however, the third projection does not fall into that range. If this scenario is to be the correct one, the SPX would need to continue the correction from 1363 a bit further, down to the next resistance level of 1313-1315. Given the wave structure of the corrective wave 4 from 1363, and the rally from 1327, this seems a low probability.
As I noted above, sub-waves usually generate two separate projections. The second projection using the sub-waves from wave 1 is near 1475. The second projection using wave 3, from 1311 to 1363, is near 1475. The entire wave structure from 1307, using 1327 as the wave 4 low, gives a projection near 1475. With all three projections converging on the same point, this seems the most likely scenario given the current data. This seems on the surface to be extremely optimistic, but that is where the data leads.
The third scenario is the one that says I am dead wrong. Given the current count, the move from 1363 cannot drop below 1310.51. If this happens, it would mean a 5 wave sequence from 1267 has most likely occurred, with the most likely outcome a re-test of the 1267 low. There is one possibility for this scenario, but the waves do not break down very well. Never the less, a break below 1311 would validate this scenario.
The most likely scenario seems to be the one that points to 1475. The corrective wave from 1363 unfolded as a nested inverted wave structure, a structure I have called out in the past. These structures normally indicate the end of a move, and are not usually found at the beginning of a move. This suggests that 1327 was the end of wave 4, and wave 5 from 1307 is now underway. This wave also terminated within the 1326-1323 support area.
The structure from 1327 also appears bullish. The waves thus far have been expanding, usually indicating a continuation of the trend. At least 3 and possibly 4 waves have completed from the low. Using that structure, and the sub-wave structure of wave 3, projects the current wave to terminate at 1358 short term. At that point the market will make a decision. If that turns out to be a wave 1, wave 3 will carry us above 1363, confirming a resumption of the uptrend, and possibly carrying the market back above 1400. Otherwise the market will turn lower. Support remains at 1326-1323, and then 1315-1313. If that support is broken, a break of 1307, and a resumption of the correction from 1422 is possible.


