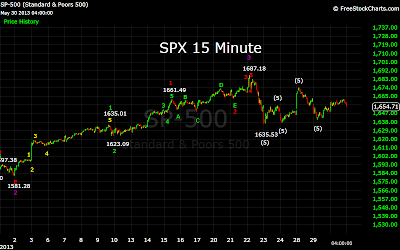
Thursday, May 30, 2013

Thursday's Market 05/30/2013

The market continued the rally from Wednesday’s 1640 low, opening higher and continuing higher throughout most of the day. After some choppiness at the open, the SPX rose steadily until it reached 1659.27. Yesterday I gave 1659 as a first target for this move. After pulling back to 1654, the SPX moved above 1660, and then pulled back to 1656. One final move higher to 1661.91 followed, but was met with some selling pressure, as the index quickly fell to 1654. The 1661.91 high was slightly below my 1665 target.


My count has the 1657.29 as the completion of a 5 wave sequence from yesterday’s 1647.69 low. This is what I thought would be Wave 4 from 1640.05. This was followed by a sequence down to 1654.27, which should have been Wave 4, and a sequence higher to 1661.91. This should have completed Wave 5, and a sequence from the 1640.05 low. However, when I put this series together, 1640.05-1648.38-1647.63-1657.29-1654.27-1661.91, it does not meet the threshold for a completion of that sequence. That would indicate that this move higher has further to go. If the SPX gets above 1662, the count I am looking at would indicate a move near 1700 is underway. This would project to the same area as a possible 5 Wave sequence from 1635.53.


Until the SPX moves above 1662, it is still possible that the market is still in a correction from the 1687 high. Any move below 1635 would mean a further decline is likely.

Thank you.


Wednesday, May 29, 2013

Wednesday's Market 05/29/2013

Not very long ago the market was going straight up, with barely a correction. It has now seemed to turn into a market that makes large moves in opposite directions from day to day. The medium term direction of the market is still unclear, with either a rise above 1700, or a steeper correction into the mid-1500’s the next likely move.


The day started with a gap down to 1646, quite the opposite of what I was expecting. After a rebound to 1653, the SPX continued lower to 1640.05. A rally was next, as the index rose to 1648, pulled back to 1642, and then rallied to 1654. The SPX then moved lower into the close, dropping to 1647.69 with only a small 4 point bounce along the way.


Going back to the 1687.18 high, the SPX completed a sequence lower at 1635.53. The index then completed sequences higher at 1655.50, lower at 1636.88, and higher once again at 1674.19. Now the SPX has completed a sequence lower at 1640.05. This series of sequences can be seen as the completion of Wave 4 at 1635.53, followed by Waves 1, 2, 3, and 4 at 1635.53-1655.50-1636.88-1674.19-1640.05. This would project a Wave 5 high of 1702-1710.

This series can also be counted as a Wave 1 down to 1635.53, and 3 waves of an inverted corrective wave at 1635.53-1655.50-1636.88-1674.19. Today’s move lower would have completed the first wave of a 5 wave sequence that would eventually become the 4th wave of that inverted corrective wave. This would indicate a move into the 1500’s. Like everyone else, I am waiting for a break of 1635.53 to indicate a move lower.

On a shorter time scale, we can look at the move off today’s 1640.05 low. It appears that the SPX completed Wave 1 at 1648.38, and was followed by an inverted corrective wave 2 that terminated at 1647.69. This would imply that the market should at least open higher tomorrow. The first target for this wave would be 1659, and the 1665. 1665 would also be the first resistance level set up by the 1674.19-1640.05 decline.

Although the medium term picture is ambiguous, short term I would look for a move to 1659, a small pullback, and a move to 1665.

Thank you.


Tuesday, May 28, 2013

Tuesday's Market 05/28/2013

The market apparently put aside any bearish sentiments over the long holiday weekend, and began the week on its familiar bullish note.


After finishing last week with back to back gap down opens, it began this one with a gap up open. After initially moving up to 1668, the SPX climbed higher, with barely a pullback until it reached 1674.19. At that point it began to pullback, and continued to pullback, until it reached 1655.03. There the pullback ended, and the SPX rose to 1663 before the close.

It is now apparent that last Thursday’s 1635.53 low was the end of the correction from 1687.18. It appears that the SPX has been forming a nested inverted corrective wave structure since then. Wave 1 ended Thursday at 1655.50. Wave 2 of the 5 wave sequence ended today at 1655.03. Wave A of 2 ended Friday at 1636.88 and Wave B this morning at 1674.19. The pullback from there completed Waves C, D, and E, to finish Wave 2. This rally should now carry the SPX to new all-time highs.

There is near term resistance at 1665. A move into that area, followed by a move below 1655 would likely end this rally.

The more likely scenario is a move above 1665 (another gap up open?), and a continuation of this move. I would look for a move to 1679, and ultimately a move to 1692-1702.

Thank you.


Monday, May 27, 2013

AAPL 05/27/2013

Since reaching an all time high of 705.07 last September, AAPL fell nearly 50% to 385.10, before rebounding to 465.75. It appears that AAPL is in a long term downtrend, which is only partially completed.


The initial move from 705.07 to 505.75 can be seen as the first impulse wave down. I see the rebound to 594.54 as Wave A of an inverted corrective wave. Wave B carried AAPL down to 385.10, and was followed by Wave C to 465.75. This count implies that we should next see Wave D lower, before another rebound comparable to the 90, and then 80 point rebounds we saw for Waves A and C. That would complete Wave 2 from 705.07, and require Waves 3, 4, and 5 to the downside. The next target for this count would be near 318.

The other possible count would be that Waves 1, 2, 3, and 4 have completed to the downside, with one more move down needed to complete the sequence. The Wave 5 low for this count would be near 280. This count would also project Wave 3 of 5 to complete at 318.

With both counts suggesting a move to the 318 level, that would seem a likely next stopping point.


Sunday, May 26, 2013

Weekend Outlook 05/26/2013

It was quite a week for the markets. The euphoria of the previous week carried over, as new all-time highs were recorded on both Monday and Tuesday. That euphoria came to a screeching halt after another all time high on Wednesday, however, as the indexes fell precipitously into Thursday morning. The markets then entered a trading range, and finished the week at a cross road ahead of the long weekend. This could be a mere pause as the markets digest the recent extreme move to the upside, or the beginning of a more extended correction. My bias up to this point has been towards a mere pause before one more move higher, but after an extensive review, the evidence seems to be mounting that a larger correction has started.


After ending the previous week in rarified air, the SPX continued to move higher this week, hitting an all time high of 1672.84 on Monday, and following that with another all time high of 1674.93 on Tuesday. The markets moved lower on Wednesday after hitting another all time high of 1687.18, falling to 1655.59, with a gap down open on Thursday bring the SPX down to 1635.53. This proved to be the low of the week, as the SPX rose to 1655.50 off that low. Another gap down open on Friday took the SPX to within a point and a half of that low, before again moving higher.

As I mentioned on Friday, the move down from 1687 can be counted two ways. The first as a completed 5 Wave sequence at 1635.53, which would be consistent with the SPX now moving higher to possible new high ground. The second count has a wave 1 completing at 1672.96, and is followed by a partially completed inverted corrective wave 2. Again, my preference up to this point has been to see this as a pullback before the SPX makes one more high. If the SPX can move above 1660 this count would remain in effect. It is becoming more and more likely that this is the start of a larger correction.

This entire move from 1343.35 to 1687.18 has been quite difficult to follow. I have been counting this move as the unwinding of a series of nested waves from the 1074.77 low. Although this count has allowed me to track the market moves fairly well, it has always seemed over complicated, and gives wide ranges for my projections. Looking at this move over different time frames, and taking into account the totality of the wave count from 666.79, there is an alternate count for that move that may ultimately work better. The start of this count remains the same; Wave 1 completed at 1448, and was followed by an inverted corrective Wave 2, which ended at 1485.01. Wave 3 then completed at 1597.35 and Wave 4 at 1536.03. A 5 wave sequence from 1343.35 then completed at 1661.49. This was then followed by an inverted corrective Wave 2, which finished at 1662.67. The move of 1684.16-1682.91-1687.18 then completed the entire sequence from 1343.35.

One of the issues with viewing the current move down as being complete is the fact that it is difficult to project the SPX moving above 1660 given the current wave structure. Most projections only have the SPX moving into the 1655-1660 area. This is not to say that it cannot happen. Again if the SPX does move above 1660, it is likely that we will see new highs.

If the SPX moves into the 1655-1660 area, and then pulls back, it would seem likely that an inverted corrective wave from 1672.96 has completed. If that happens, then my projections start to converge around the 1540 level. If a 5 wave sequence completed at 1687.18 as discussed above, this could be the last wave of an inverted corrective sequence from 1422.38. This would take the form 1422.38-1266.74-1470.96-1343.35-1687.18-X. This would project the current wave to complete above 1542. In addition the secondary support level indicated by the sub-wave structure is 1550 (the primary support level is 1654). Lastly, if an inverted corrective wave completes at 1655-1660 from 1687.18, it would project the entire sequence to complete at 1542.


Although this market can still go either way, at this point I can give some parameters that would signal a breakout in either direction. Above 1660, the SPX should move to new highs. A move back below 1635 should mean this downtrend should continue to 1542.

Thank you.


Friday, May 24, 2013

Friday's Market 05/24/2013

Today looked like a mirror image of yesterday, with a gap down open, followed by a steady move higher. The move lower was expected, however the unexpected part was that yesterday’s low held. That could be an important indication of what is to come.


The SPX gapped lower at the open, dropping initially to 1640.12, and then chopped its way lower to 1636.88. From there the index moved higher, reaching 1645.78 shortly after noon. After a small pullback to 1642.45 the market continued higher, reaching 1649.61 before the next pullback. This pullback took the market to 1645.14, and was followed by a steady move higher into the close, slightly eclipsing the 1649.61 high at 1649.78 just before the close.

From this morning’s 1636.88 low the action seems fairly straightforward. The SPX completed a 5 wave sequence higher at 1645.78, followed by the completion of a higher degree sequence at 1649.61. After the ensuing pullback, the SPX then moved above that 1649.61 high, indicating the index is still completing a higher degree sequence to the upside.


The fact that today’s move lower did not take out yesterday’s low, and the action subsequent to that, forced me to re-evaluate my count from the 1687 high. I see two main possibilities at the moment, and I will start with what I see as the most likely one. The move from that high can be counted as a 5 wave sequence; 1687.18-1674.28-1683.10-1665.38-1670.33-1635.53. Wave B of this sequence, 1674.28-1683.10, was a semi-inverted corrective wave. This count would indicate that 1635.53 was the low of this corrective wave, which in my count is Wave 4, and should be followed by Wave 5 to new all-time highs. If this count turns out to be correct, the action from that low appears to be a nested wave structure, which usually results in a rapid move.

The alternate count at this point is Wave A at 1672.96, with the move up to 1683.10 as the first wave of an inverted corrective wave. Wave B of that wave would be yesterday’s drop to 1635.53, and Wave C the recovery to 1655.50. Wave D would be this morning’s drop to 1636.88. This Wave would complete between 1654 and 1659.

If the SPX can get above 1660, it is most likely that the correction has completed, and we will move to new highs soon. If this move stalls below 1660, the market should make new short term lows. It should be an interesting week.

Thank you.


Thursday, May 23, 2013

Thursday's Market 05/23/2013


As strange as it sounds, the SPX did NOT make an all-time high today.  


The SPX gapped lower this morning, and within minutes the index had fallen to 1635.53. From there the SPX bounced to 1647, and after a small pullback, continued higher to 1654. The index then fell back to 1645, before heading higher to 1655.50, thus closing the opening gap. After that the SPX drifted lower into the close, dropping to 1648.82.

In yesterday’s post I indicated the market may move lower, giving a target of 1641. This would have completed a 5 wave sequence from the 1687.18 high as 1687.18-1672.96-1660.80-1648.86-1655.43-1641. Today’s lower opening exceeded the lower limit for this count, which most likely means that today’s 1635.53 low only completed wave 3 of the sequence. This was confirmed as the move from 1660.80 completed a 5 wave sequence at that low. This was followed by a 5 wave sequence higher to 1655.50, which should be wave 4 of the sequence. If this count is correct, wave 5 of this sequence should complete between 1632 and 1623. This should in turn complete Wave 4 from 1074.77, and set the stage for one more move to new highs before a larger correction develops.

So, for the short term, I am expecting a move lower to 1632-1623, followed by a move to new highs. If the SPX moves above 1661 from this point, I would expect the market to continue higher to new high territory.

Thank you.


Wednesday, May 22, 2013

Wednesday's Market 05/22/2013


It was an interesting day for the markets, to say the least. A sharp rise to another all-time high, followed by the biggest decline we have seen in over a month.


The SPX opened higher, rose to 1684, and after a minor pullback, hit 1687.18. But it was all downhill after that. The SPX dropped to 1673, tried to rally, but after hitting 1683 started a steady decline that dropped the index to 1648.86. The SPX then rose to 1655 into the close.

As I mentioned yesterday, I expected a move above 1677 to lead to higher prices. It did, as the SPX rose to 1687, although you had to be quick to catch that move. At 1687 the SPX completed a 5 wave sequence from 1662.67, and has finally completed a sequence from 1581.28. This completes Wave 3 from 1074.77. A pullback had been expected once Wave 3 ended, and it looks like we saw the majority of it today. At this point it appears that only 3, and possibly 4, waves of this corrective sequence have completed. I expect to see another move down, with a target of 1641. I would then expect one more move to new highs before a more substantial correction occurs.

Thank you.


Tuesday, May 21, 2013

Tuesday's Market 05/21/2013


I thought that yesterday afternoon’s 1663.52 low completed an inverted corrective wave from 1661.49. As it turns out that was Wave 1 of E from that high.


The SPX did move higher at the open, but managed only to get to 1672 before turning lower. The index moved below 1663.52, falling to 1662.67 before reversing course once again. The SPX moved steadily higher until it hit another, you guessed it, all-time high at 1674.07. After a minor pullback the SPX moved higher again, surpassing 1674.07, and rising to 1674.93. From there we saw another pullback, this time taking the SPX to 1668.70 near the close.

As I mentioned above, yesterday’s 1663.52 low completed only Wave 1 of E. This morning’s rise was Wave 2 and the decline from that high resulted in Waves 3, 4, and 5 completing. This did complete the inverted corrective wave, and from there the SPX moved higher. The SPX completed a sequence at 1674.93, and then what appears to be a corrective sequence to 1668.70.

The current market set-up is quite interesting. My expectation has been that the SPX should complete a 5 wave sequence from 1581.28, which would be followed by a small correction, and then another 5 wave sequence higher to complete the sequence from 1074.77. The market has continued to complete sequences, and then go on to form larger degree sequences while moving higher. The first of these sequences completed at 1635.01, the second at 1661.49, and now the SPX has started forming another sequence. Waves 1 and 2 of the current sequence have completed, with Wave 2 being the recently completed inverted corrective wave. It is possible that today’s rise to 1674.93, and decline to 1668.70 were Waves 3, and 4. If this is correct, Wave 5 of this sequence should complete between 1675 and 1677. This would appear as a diagonal triangle. I would then look for a move below 1668 to confirm this scenario.  This would then be the start of the corrective sequence lower.

If the SPX moves above 1677, it would be most likely that today’s rise to 1674.93 was simply wave 1 of 3. This would indicate a further move higher before a correction.

Thank you.


Monday, May 20, 2013

Monday's Market 05/20/2013


Hard to believe. Another all-time high for the SPX. At times it seems like this will never end, but we all know it will. Sometime. If today was not the start of a small pullback, it should be coming soon.


After another gap open, the SPX hit 1658.31 before pulling back. The SPX then moved higher to 1660.74 before another minute pullback. From there the market moved steadily higher, hitting 1672.84. That was followed by a somewhat larger pullback to 1663.52. This 9 point pullback was similar in magnitude to the 11, and 12 point pullbacks we saw last Wednesday and Thursday.

The rise from Friday’s 1648.60 low to 1672.84 completed in a 5 wave sequence. The drop to 1663.52 would then seem to complete an inverted corrective wave from Wednesday’s 1661.49 high. We should now see one more move higher to complete the sequence from 1581.28.

To review, 1581.28 was the termination point for Wave 2 from 1074.77. Once the SPX completes a 5 wave sequence it will complete Wave 3. At that that point I would expect a correction, followed by another move higher to complete Wave 5. That is the point at which I would expect a more substantial correction.

So far, from 1581.28, the SPX completed 5 waves to 1635.01, and then a higher degree sequence at 1661.49. The three aforementioned pullbacks formed the inverted corrective Wave 2, and should be followed by waves 3, 4, and 5 higher. Because of the structure, it would be possible to complete this sequence without making a new high.

If the SPX moves to 1668, and then falls below 1663.52, I would expect a pullback has begun. Should the SPX move above that level, 1677-1681 could be the next stop.

Thank you.


Friday, May 10, 2013

Friday's Market 05/10/2013


Although the SPX tried mightily towards the close, it failed to reach a new time for the first time in what seems a month. The mettle of both the Bulls, and the Bars was tested today, as the market first looked like it was going to break lower, then looked like it was going to move into new high ground, but in the end did neither. It was a very interesting wave structure today; one we have seen before.


The market worked its way higher this morning, coming off yesterday’s decline. The SPX first hit 1630, pulled back to 1626, and then continued higher to 1632. From there the market sold off, dropping to 1625. A rally to 1630 followed, but that was met by more selling pressure, and the SPX fell back below 1624. A choppy uptrend followed, as the SPX worked up to 1630.28, just above the initial rally this morning to 1630.17. After a very minor pullback, the SPX rose sharply to the high of the day at 1633.47.

Those who have followed me have heard me talk about a semi-inverted corrective wave in the past, and I believe that is exactly what we saw today. Off of a low, this structure would have a move up for wave 1, and a pullback for wave a of 2 Wave b of 2 then exceeds the wave 1 high, with waves c, d, and e of 2 forming a zig-zag pattern that terminates below wave a of 2. Wave 3 then generally ends just above wave 1, with wave 4 being a small pullback. Wave 5 is then usually a sharp move higher. Looking at the wave structure from yesterday’s 1623 low, that is exactly what we had today. If you go back and look at the wave from 1357.38 following the 1422.38 high, you will see the same structure. That is not to say the eventual outcome will be the same. I do see 1635.01 as the completion of a 5 wave sequence from 1074.77, with my first support level at 1599.

Thank you.