Monday, September 16, 2013

Monday's Market 09/16/2013

It was another gap up open for the SPX, as the index moved above 1700 for the first time since early August. After moving up to 1703.74 after the open, the SPX pulled back to 1698.77, and then made one more push higher to 1704.95. After that the index moved steadily lower, dropping to 1695.15 before moving a bit higher into the close.


It still appears that the SPX is in a wave 5 from the 1627 low, with a target of 1745. I see wave 4 having completed last Thursday at 1681.96. From that point, it looks like the index completed a sequence this morning at 1703.74, and then formed a complex corrective wave into the afternoon low of 1695.15. This looks to be waves 1, and 2 of this 5th wave.

Support remains at 1685, 1669, and then 1651.


Saturday, September 14, 2013

Weekend Outlook 09/14/2013

Last Friday, with the SPX at 1655, I targeted the 1680-1687 range as a possible battleground for the bulls and the bears. On Tuesday morning the index moved above 1680, and the remainder of the week was spent between 1678.29, and 1689.97. On Wednesday the SPX moved above 1687.18, the upper limit for my semi-inverted corrective wave scenario that would have targeted a move lower to below 1560. This means that it is most likely that the index will continue higher, likely taking out the 1709 all-time high.


This has been a trying week for bulls and bears alike, and it seems only fitting that the market should head into the weekend without a clear resolution. I am still looking for the market to move higher, but I would feel more confident if the SPX could clear this 1685 support zone with some authority. Nevertheless, the SPX has moved above what I consider a critical level, 1687, and the wave structure still supports a move higher.


From the 1627.47 low, the SPX completed a 5 wave sequence to 1641.18. From that point, it formed a semi-inverted corrective wave that terminated at 1628.05. It was at this point that I indicated the index was poised to make an extremely powerful move to the upside. This semi-inverted corrective wave turned out to be but the first wave of an extended inverted corrective wave that eventually completed at 1640.62. So from 1627.47 the SPX has completed a wave 1 at 1641.18, and a wave 2 at 1640.62. The next move higher was to 1664.83, and looks to be wave 3 from 1627. This was followed by another inverted corrective wave that completed wave 4 at 1681.96. This gives an optimal target of 1639 for wave 5, very close to my original 1645 target.

When the SPX moved off its 1560.33 low in late June, I set a target of 1776. This target came into question as the index pulled back off the 1709 high, and eventually found its way to 1627. In my post on 9/4/13, http://5wavemodel.blogspot.com/2013/09/wednesdays-market-09042013.html, I outlined a scenario where the SPX could still reach that target. This entails the index forming 5 waves from the 1560 low that would complete a sequence from 1074.77 at 1773. These waves would go something like 1709.24-1627.47-1745-1680-1773. Given the discussion above, this seems to be a likely scenario. This would not complete a sequence from the 666.79 low, so there should be at least one more move to the upside after that.

For the week ahead, I am looking for a continuation of the move higher from 1627, with a target of 1745. My current wave count requires the SPX do hold above 1682. A break of that level at this point and the index could correct further, with support at 1669, 1651, and then 1621.


Thursday, September 12, 2013

Thursday's Market 09/12/2013

The SPX opened slightly higher this morning, moving up to 1689.29 before pulling back. After falling to 1685.71, the index turned higher, reaching 1689.97. After that, the SPX spent the rest of the day working its way lower, falling to 1682.30, and then bouncing to 1687.39 before falling back to 1681.96 just before the close.


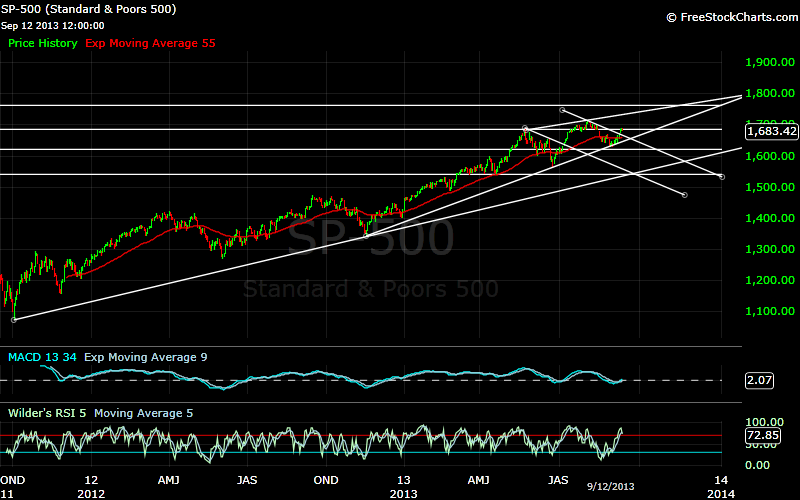
Today’s 1689.97 high appears to complete the sequence from the 1654.45 low. The possible inverted corrective wave 4 I mentioned yesterday seems to have been incorrect, with the SPX actually completing a smaller degree wave sequence from 1678.29 to today’s high. From 1627.47 the market has now completed a sequence to 1641.18, which I see as Wave 1, followed by a complex corrective Wave 2 which completed at 1640.62.

From there I had been counting 1664.83 as Wave 3, 1654.45 as Wave 4, with Wave 5 possibly completing above 1683. With a 5 wave sequence from 1654.45 having now completed, it is possible that the SPX has reached at least a short term high. However, the entire move from 1640.62, Wave 2 from 1627, until today’s low at 1681.96, looks technically like a single wave. This would fit the inverted corrective wave scenario I spoke of yesterday, or the move from 1640.62 to 1654.45, was of a lesser degree than the move from 1627 to 1641.18. At the moment this scenario seems more likely.

This is supported by the move from 1664.83 to today’s low counting as an inverted corrective wave of some degree. This would mean the SPX should move higher off today’s 1681.96 low. This wave could possibly carry to 1676.70, but would more likely move higher from the open.

If the SPX moves below 1676.70, it would be most likely that a top from 1627 has been put in at 1689.97, and a pullback would then be expected. I think it more likely that the SPX will continue higher from this point, with 1745 remaining a likely target.

Support is at 1685, 1669, and then 1651.