After the SPX hit a low of 1560.33 on June 24th,
the index advanced in a relatively easy to follow manner until it reached
1684.51 on July 15th. The SPX completed a 5 wave sequence higher to
1626.61, which was followed by a corrective sequence, and then another sequence
higher to 1684.51. Since that point, the index has traded in a fairly narrow
range, bounded by 1672 on the lower end, and 1709 on the higher end. The price
action during that span has been quite choppy, and difficult to track on a
short term basis. During each sequence, the market tends to reach a point of
indecision that tests the resolve of participants. It seems we are at that point
now. At times like these, it is best to consider all possibilities, determine
the most probable course of action, but be prepared for other potentialities.
After reaching an all time high last Friday of
1709.36, the SPX opened lower on Monday, rallied to challenge that high at
1709.24, and then traded flat for the remainder of the day. On Tuesday and
Wednesday the index opened markedly lower, and then drifted higher onto the
close. On Tuesday the SPX hit a low of 1693, and 1685 on Wednesday. Thursday saw
a gap up open, followed by a drop to close the gap, and then a rally to just
below the opening highs. The SPX opened lower again on Friday, tested the 1685
low, but held above it, and then moved higher.

When considering the possible short term direction
of the market, it is important to also understand where the market is on a
larger scale. Starting with the weekly chart, the SPX has completed 4 sequences
from the 666.79 low. These completed at 1219.80-1010.91-1370.58-1074.77. It is
not possible, given the sequences already completed, for a larger sequence to
terminate with this uptrend. The SPX is forming a complex corrective wave, with
the implication being that this bull market has further to run after this
uptrend completes. Using the sub-waves of the move from 1010.91 to 1370.58, the
minimum projection for the current uptrend would be 1708, which we have
surpassed. The range for this sequence is admittedly somewhat large, but it
gives an initial target. My current target of 1776 also falls within this
range. One technical point of note on this chart is the RSI(14). Notice at the
1010.91 low, this indicator bottomed at 38.05, while it reached a lower low of
29.67 when the market corrected to 1074.77. This lower low on the RSI(14),
coupled with a higher price low, is seen often during the formation of complex
corrective waves.

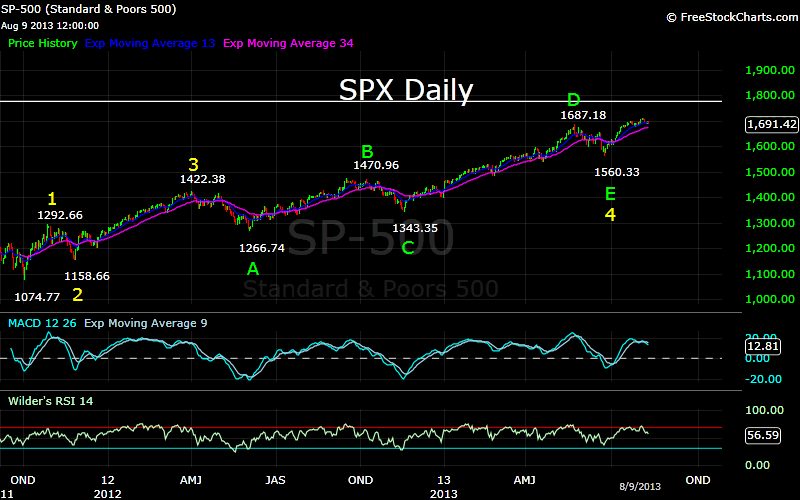
The Daily chart clearly shows the SPX in the ninth
wave from the 1074.77 low. This is supported by not only the sub-wave counts
within each individual wave, but by technical indicators such as the RSI(14),
and the MACD. My current count has waves 1, 2, and 3 completing at
1292.66-1158.66-1422.38. This was followed by an inverted corrective wave 4 at
1266.74-1470.96-1343.35-1687.18-1560.33. The three declines during this period
were 156, 128, and 127 points. Notice the proportionality of those declines,
and the fact that the declines decrease as the starting points increase. Given
this count, Wave 5 projects to a minimum of 1776.

Cutting through all the noise, and looking
strictly at the 60 Minute chart from the 1560.33 low, it certainly appears as
if the SPX completed a wave 1 at 1626.61, and has been followed by an inverted
corrective wave 2 at 1604.57-1698.38-1676.03-1709.24-1684.91. These declines
have been 22.04, 22.35, and 24.33 points. Again the lengths of the declines
have been similar, and have increased slightly as the starting point has
increased. Also notice the lower RSI(14) readings at points A, C, and E. Lower
readings on the indicator, coupled with higher lows on the index. This count
would suggest that 1684.91 was the low, and the SPX should now continue higher
from here.
Given my target of 1776, the likely course of
action would be a move to around 1748, followed by a pullback, and then another
move higher to 1776. Shorter term, I have an initial upside target of 1711.
That is my case for the bullish scenario. It is
possible, given the action of the market lately that this will not play out as
I suggest. If the SPX breaks below 1685, the next likely target is 1668. Even
if 1685 does not hold, I expect to see 1776 before 1560.