Tuesday, March 19, 2013

Tuesday's Market 03/19/2013


 The market opened to the upside this morning, rising above 1557 before falling back to 1550. After a short-lived rebound, the market broke through yesterday’s 1545 low, and fell to 1538.57 with only one feeble attempt at moving higher. After that, the market staged a pretty good rally, moving above 1550 once again. A pullback followed, with the market turning higher into the close.

Yesterday I called for the market to open slightly lower before moving up to 1558, with a test of the 1545 low to follow. I was wrong about the lower opening, with the explanation coming shortly, but the market then acted as expected.
 
As for the explanation, I will break down the current wave from Friday’s 1563.62 high. The move from that point to 1555.74 formed Wave 1 of the current wave. The SPX moved to 1562.86 after that, which I interpret as Wave 1 of an inverted corrective Wave 2 from 1563.62. The market completed another 5 Wave sequence at 1557.29, which is Wave 1 of a sequence one degree smaller than the 1563.62-1555.74 wave. The bounce to 1560.70 is where I went wrong. Yesterday I interpreted that as Wave 1 of a second inverted corrective Wave 2. This is a set-up I refer to as a nested inverted corrective wave. It was under this assumption that I gave my forecast as I did. Today’s action made it clear that the bounce to 1560.70 was the completion of Wave 2 for that sequence that completed today as 1562.86-1557.29-1560.70-1545.13-1558.73-1538.57. This sequence then completed Wave 2 of the inverted corrective wave from 1555.74.
The market should now be in Wave 3 of that inverted corrective wave. From the low of 1538.57 I see wave 1, an inverted corrective wave 2, wave 3, and what appears to be wave 4, which concluded shortly before today’s close. T o complete the inverted corrective wave 2 from 1555.74, the market should move higher to 1554, pullback 1545, and then move higher to 1557. The market would then need to complete waves 3, 4, and 5 to complete the wave from 1563.62. I still look for 1535 to be the downside limit of this correction. It is possible that we have seen the low of this wave. With the low of 1538.57 being part of an inverted corrective wave, Wave 5 of the sequence could very well terminate above that level.
 
 
This scenario also fits in well with a timing model I have been developing. This timing model called for the end of this corrective wave to terminate late Wednesday afternoon. If the market should move higher at the open, and then fall to 1545 in the morning, the final move to 1557 mentioned above could occur in a couple of hours. With the FOMC concluding its meeting tomorrow afternoon, there would be enough time to complete Waves 3, 4, and 5 to the downside. The FOMC statement could then provide the impetus for the next move higher, or the final push lower if it has not already completed.
I have been a little long winded, so I will wrap this up here. The market should move higher tomorrow morning, first to 1554, and then 1557. This should be followed by a test of today’s 1538.57 low, which should hold above 1535. That will then complete the wave from 1563.62, and the inverted corrective wave from 1470.96, clearing the way for the market to move higher, to above 1608.


Monday, March 18, 2013

Monday's Market 03/18/2013


The market started the day with a sharp sell-off, with the market dropping to 1545.13 within the first few minutes of trading. By midday the SPX had recovered to 1558 before the sellers came back. After falling to 1554, the market once again moved higher, this time to nearly 1559. At this point the sellers once again stepped up, and took the market down to 1550 shortly before the close.
 
This market has been quite interesting and quite difficult for some time. Of course that is half the fun. It now appears the market completed a 5 Wave sequence from 1485.01 last Friday at 1563.62. Since then the market seems to be forming a nested inverted corrective wave from that point. If this interpretation is correct, the bias of the market for the next several days should be down, but should also be quite choppy.
Near term, I expect a lower open tomorrow, back near 1550. After that the market should rise to 1559, before testing today’s 1545 low.
 
For the medium term, the market is now in Wave 5 of an inverted corrective wave from 1470.96. This count can be seen on the Daily chart. If this count is correct, I would expect this correction to conclude above 1535.  From there I expect the market to move higher, with my next target still above 1608.
 
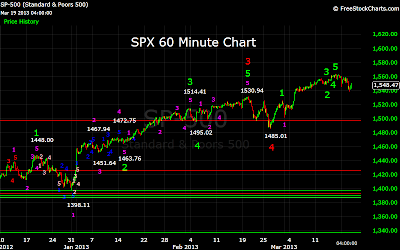
It is interesting to compare the current inverted corrective wave from 1470.96 on the Daily chart to the one that formed on the Hourly chart between 1448.00 and 1463.76. This would be between waves 1 and 2 in green on the Hourly chart. It is also interesting to not what happened at the conclusion of that wave. Time will tell if we see the same thing.


Sunday, March 17, 2013

Weekend Outlook 03/17/2013


Again, I apologize for having been away for some time.

In my Weekend Outlook of September 9th, I said the current wave from the March 2009 low of 666.79 should terminate somewhere above 1560. With that milestone having been achieved this past week, I thought it an appropriate time to try to resume my blog.

Since it has been some time since I posted, and I have updated some of my counts, I will start with the longer term outlook, and work my way down from there. On the weekly chart you can view my count from the 667 low. It is now most likely that a 5 Wave sequence completed at 1370.58. The breakdown for this count would be 666.79-956.23-869.32-1219.80-1010.91-1370.58. The market corrected to 1074.77 from that high, before resuming the uptrend. So far the market has completed two impulsive 5 Wave sequences to the upside from that point, with two intervening corrective sequences. The third sequence to the upside is now unfolding. The target for this wave would be 1608-1664.
 
If we look at the wave structure from the 667 low to 1371, we can see that it was a simple 5 Wave structure, with no complex corrective waves. This would imply that 1370 is Wave 1 of another simple 5 Wave structure higher, with wave 3 shorter than wave 1, and wave 5 shorter than wave 3. A move to 1608-1701 would then complete Wave 3 from 667, and I would expect Wave 4 to follow. This would then require a fairly severe correction, perhaps to 1200-1250, before the uptrend resumes, with an ultimate target of 1688. The 5 Wave sequence from 667 would then be 666.79-1370.58-1074.77-1608-1212-1688.
 
On the Daily chart we can see the progress of the wave from the 1074.77 low. The market has complete 4 waves thus far, with Wave 5 sub-dividing. So far the sequence is 1074.77-1292.66-1158.66-1422.38-1266.74, with a Wave 5 target of 1540-1664. The sub-dividing Wave has also completed 4 waves, 1266.74-1470.96-1343.35-1530.94-1485.01, with a Wave 5 target of 1608-1701. Combining these two targets gives us the 1608-1664 target for Wave 3 from 667.
 
In the near term, the market only needs to complete a 5 Wave sequence from 1485.01 between 1608 and 1664 to complete Wave 3 from 667. This wave has been quite complex, and has two possible course at the moment. The sequence could move higher straight to 1608-1664, or we could see a short term top at 1565. From there I would anticipate a pullback before the resumption to above 1608. The first support level is 1554, and then 1528-1535.
 
If the market clears 1565, the market should move above 1608, with a substantial correction to follow, possibly to 1200-1250. If the market encounters resistance at 1565, and falls below the 1554 support, it could move to 1528-1535 before rising above 1608.